. 2024 May 21;5(5):101526.
doi: 10.1016/j.xcrm.2024.101526. Epub 2024 Apr 25.

Development of a chimeric cytokine receptor that captures IL-6 and enhances the antitumor response of CAR-T cells

Affiliations

Development of a chimeric cytokine receptor that captures IL-6 and enhances the antitumor response of CAR-T cells

Toshiaki Yoshikawa et al. Cell Rep Med. .

Abstract

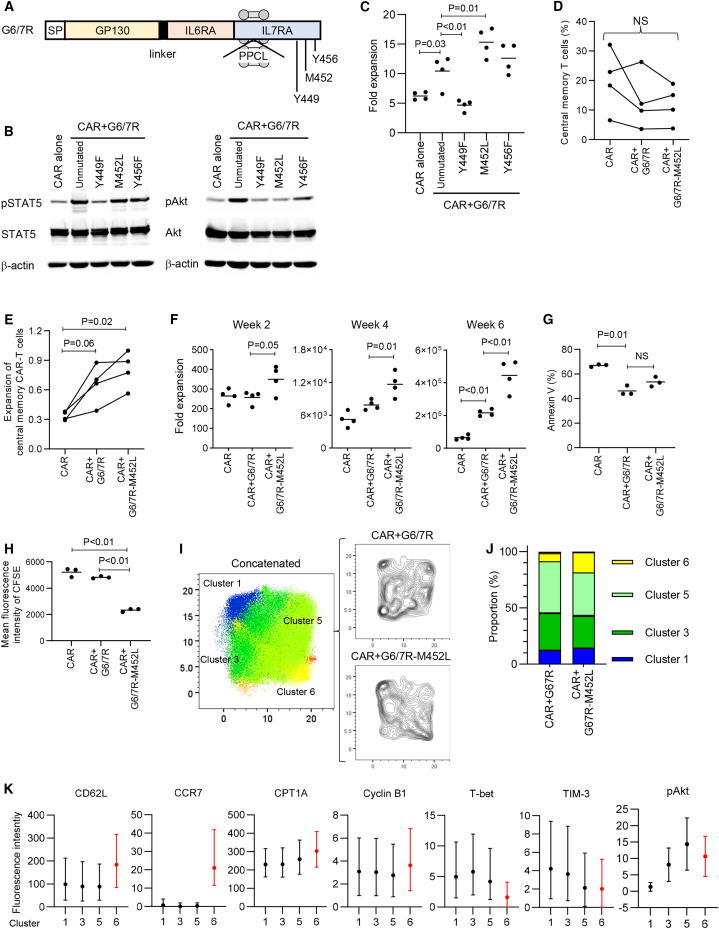
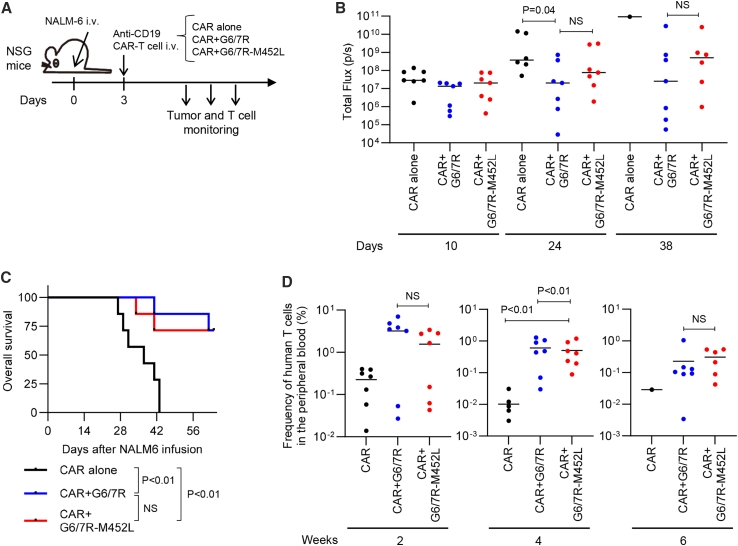
The efficacy of chimeric antigen receptor (CAR)-engineered T cell therapy is suboptimal in most cancers, necessitating further improvement in their therapeutic actions. However, enhancing antitumor T cell response inevitably confers an increased risk of cytokine release syndrome associated with monocyte-derived interleukin-6 (IL-6). Thus, an approach to simultaneously enhance therapeutic efficacy and safety is warranted. Here, we develop a chimeric cytokine receptor composed of the extracellular domains of GP130 and IL6RA linked to the transmembrane and cytoplasmic domain of IL-7R mutant that constitutively activates the JAK-STAT pathway (G6/7R or G6/7R-M452L). CAR-T cells with G6/7R efficiently absorb and degrade monocyte-derived IL-6 in vitro. The G6/7R-expressing CAR-T cells show superior expansion and persistence in vivo, resulting in durable antitumor response in both liquid and solid tumor mouse models. Our strategy can be widely applicable to CAR-T cell therapy to enhance its efficacy and safety, irrespective of the target antigen.

Keywords: CAR-T; IL-6; IL-7; JAK-STAT signaling; adoptive immunotherapy; chimeric antigen receptor; cytokine release syndrome; hematological malignancy; neurotoxicity; solid tumor.


Conflict of interest statement

Declaration of interests This study was partly supported by a commercial research grant from Takara Bio, Inc. S.O. and Y.A. are employees of Takara Bio Inc. Aichi Prefecture has filed a patent application related to this study on which Y.K. and T.Y. are named as inventors.

Figures

None
Graphical abstract
Figure 1
Figure 1
Construction of a chimeric receptor that captures IL-6 into T cells (A) A schematic diagram of the chimeric receptor developed in this study. Extracellular IL6R or fusion domains of GP130-IL6R were combined with constitutively active IL7R containing PPCL residues to form 6/7R or G6/7R, respectively (SP: signal peptide). (B) T cells transduced with anti-CD19 CAR alone or anti-CD19 CAR and 6/7R or G6/7R were incubated in the presence of recombinant IL-6 (3,000 pg/mL). The concentration of IL-6 within the culture supernatants was analyzed 48 h later (n = 3 cultures, one-way ANOVA with multiple comparison test). Representative data of two independent experiments. (C–E) Anti-CD19 CAR-T cells with or without ectopic expression of G6/7R were treated with 40 ng of recombinant IL-6. Extracellular (D) and intracellular (E) concentrations of IL-6 at the indicated time points were measured by ELISA (n = 3 cultures, unpaired two-tailed Student’s t test; ND, not detected). (F) Experimental design demonstrating the infusion of T cells engineered with anti-CD19 CAR alone or with anti-CD19 CAR and G6/7R into NALM6-bearing NSG mice followed by intravenous administration of recombinant IL-6. (G) Plasma IL-6 levels were quantified at the indicated time points (n = 7 mice, unpaired two-tailed Student’s t test of the log-transformed values). In (B), (D), (E), and (G), horizontal lines denote mean values. See also Figure S1 and Table S1.
Figure 2
Figure 2
Constitutive IL-7 signaling confers a proliferative advantage to anti-CD19 CAR-T cells (A and B) T cells transduced with anti-CD19 CAR alone or in combination with 6/7R or G6/7R were rested overnight in cytokine-free media and left untreated or treated with 10 ng/mL IL-6 for 30 min. Representative fluorescence-activated cell sorting plots (A) and mean fluorescence intensity (B) of phosphorylated STAT5 and STAT3 in the CD3+ T cell population (n = 4 cultures, unpaired two-tailed Student’s t test for comparison between untreated and IL6-treated samples; one-way ANOVA with multiple comparison test for comparison among different CAR-T cells. NS, not significant. (C–E) Anti-CD19 CAR or anti-CD19 CAR+G6/7R T cells were rested overnight in cytokine-free media and left untreated or treated with IL-6 for 30 min, and their gene expression profiles were compared by RNA-seq (n = 3 different donor samples for each). (C and D) Principal component analysis (C) and unsupervised hierarchical clustering (D) of differentially expressed genes among the four groups (false discovery rate [FDR] < 0.01). (E) Gene set enrichment analysis (GSEA) between control and G6/7R-expressing rested CAR-T cells. Genes induced by IL-7 were used as gene sets (n = 3 samples, p values were calculated by an empirical phenotype-based permutation test). (F) Fold expansion of anti-CD19 CAR alone or anti-CD19 CAR and G6/7R-engineered T cells 1 week after stimulation with NALM-6. CAR-T cells were cultured without cytokine supplementation (n = 4 cultures, unpaired two-tailed Student’s t test). Representative data of three independent experiments. (G) Fold expansion of anti-CD19 CAR or anti-CD19 CAR and G6/7R-transduced T cells restimulated with NALM-6 once and cultured in the presence of IL-2 without additional antigen stimulation (n = 4 cultures, unpaired two-tailed Student’s t test at each time point, ∗∗p < 0.01). (H) The proliferation of anti-CD19 CAR and anti-CD19 CAR+G6/7R T cells incubated with or without 20 ng/mL IL-6 for 3 days without antigen stimulation (n = 4 cultures, one-way ANOVA with multiple comparison test). (I) Cytokine production of anti-CD19 CAR-T cells with or without G6/7R upon restimulation with NALM-6 was analyzed by intracellular flow cytometry (n = 4 different donor samples, paired two-tailed Student’s t test). (J) Cytotoxic activity of anti-CD19 CAR or anti-CD19 CAR+G6/7R T cells against the indicated target cells as evaluated by flow cytometry (n = 3 cultures, unpaired two-tailed Student’s t test). In (B), (F), (H), and (J), horizontal lines denote mean values. See also Figure S2.
Figure 3
Figure 3
Attenuated Akt signaling in G6/7R-M452L supports long-term proliferation of anti-CD19 CAR-T cells (A) A schematic diagram of the individual mutants in G6/7R. (B) T cells transduced with anti-CD19 CAR alone or with anti-CD19 CAR and G6/7R with the indicated mutations were rested overnight in cytokine-free media. Immunoblotting evaluated the phosphorylated and total levels of STAT3, STAT5, and Akt. Representative data of two experiments. (C) Anti-CD19 CAR or anti-CD19 CAR+G6/7R T cells with the indicated mutations were stimulated with NALM-6 and cultured without exogenous cytokines. The data shown are fold expansion of the CAR-T cells on day 7 following stimulation (n = 4 cultures, one-way ANOVA with multiple comparison test). Representative data of three independent experiments. (D–H) Anti-CD19 CAR-T cells with or without ectopic expression of G6/7R or G6/7R-M452L were restimulated with NALM-6. The data shown are the frequency (D) and fold expansion (E) of CD8+ central memory T cells on day 7 (n = 4 different donor samples, repeated measures one-way ANOVA with multiple comparison test), cumulative fold expansion of CAR-T cells upon weekly stimulation until week 6 (F, n = 4 cultures, one-way ANOVA with multiple comparison test), the frequency of Annexin V+ cells on day 7 (G, n = 3 cultures, one-way ANOVA with multiple-comparison test), and mean fluorescence intensity of CFSE on day 7 (H, n = 3 cultures, one-way ANOVA with multiple-comparison test). In (H), T cells were labeled with CFSE before stimulation. NS, not significant. (I–K) Mass cytometry analysis was performed in G6/7R and G6/7R-M452L anti-CD19 CAR-T cells 7 days after restimulation. (I) An EmbedSOM-based plot of concatenated samples to visualize the distribution of G6/7R and G6/7R-M452L CD8+ CAR-T cells. Individual cells are colored according to the clusters obtained by FlowSOM. Each sample consists of a pool of three cultures from one donor. (J) Proportions of each cluster in G6/7R and G6/7R-M452L CAR-T cells. Color annotations are provided for the four major populations (clusters 1, 3, 5, and 6). (K) Distribution of fluorescence intensity of the indicated molecules in each cluster. Median values with interquartile range are shown. In (C) and (F–H), horizontal lines denote mean values. See also Figure S3 and Table S2.
Figure 4
Figure 4
Superior antitumor effects of G6/7R-M452L anti-CD19 CAR-T cells in a leukemia model (A) Experimental design showing the transplantation of NALM6-GL-bearing NSG mice with 5 × 105 anti-CD19 conventional CAR-T cells or G6/7R- or G6/7R-M452L-expressing CAR-T cells on day 3. (B) The total flux of luciferase activity was quantified by in vivo bioluminescent imaging at the indicated time points following NALM6-GL infusion (n = 7 mice for each group, one-way ANOVA with multiple comparison test of the log-transformed values). (C) The Kaplan-Meier curve for progression-free survival of the treated mice (n = 7 mice, log rank test). The data shown are a composite of three independent experiments. (D) The frequency of human T cells in the peripheral blood at the indicated time points (n = 7 mice, one-way ANOVA with multiple comparison test of the log-transformed values). In (B) and (D), horizontal lines denote mean values. See also Figure S4.
Figure 5
Figure 5
G6/7R-M452L enhances the antitumor efficacy of anti-mesothelin CAR-T cells against solid tumors (A) Fold expansion of mesothelin or GD2-targeting CAR-T cells transduced with G6/7R or G6/7R-M452L after restimulation with the target antigen (n = 4 cultures, one-way ANOVA with multiple comparison test). (B) NOG-ΔMHC mice were subcutaneously inoculated with the pancreatic cancer cell line AsPC-1 and treated with anti-mesothelin CAR-T cells with or without different cytokine receptors. CAR-T cells were also transduced with the luciferase gene. (C) Tumor volume was monitored longitudinally (n = 6 or 7 mice for each). (D) Human T cell frequencies were analyzed in peripheral blood at the indicated time points (n = 6 or 7 mice for each, one-way ANOVA with multiple comparison test). (E) In vivo bioluminescence imaging was used to quantify the total flux of luciferase activity (n = 6 or 7 mice for each, one-way ANOVA with multiple comparison test for the log-transformed values). (F) Body weight of the treated mice relative to the weight on day 0 (n = 6 or 7 mice for each). ∗p < 0.05, ∗∗p < 0.01. In (A), (D), and (E), horizontal lines denote mean values. See also Figure S5.
Figure 6
Figure 6
Functional and phenotypic properties of G6/7R-M452L anti-mesothelin CAR-T cells in a solid tumor model (A) NSG mice subcutaneously inoculated with AsPC1 were infused with T cells engineered with anti-mesothelin CAR alone or anti-mesothelin CAR and G6/7R-M452L. CAR-T cells were cotransduced with the luciferase gene. (B) Monitoring of the subcutaneous tumor volume (n = 7 mice for each). (C) Progression-free survival of the treated mice (n = 7 mice, log rank test). (D) Frequency of human T cells in the peripheral blood at the indicated time points (n = 7 mice, unpaired two-tailed Student’s t test). (E) The total flux of the luciferase activity was analyzed by in vivo bioluminescent imaging (n = 7 mice, unpaired two-tailed Student’s t test of the log-transformed values). In (A)–(E), the data are a composite of two independent experiments. ∗p < 0.05, ∗∗p < 0.01. (F and G) The subcutaneous tumor was harvested 6–9 weeks following anti-mesothelin CAR-T cell infusion in the AsPC-1 tumor model shown in (A). (F) Percentage of CD8+ CAR-T cells expressing exhaustion markers (PD-1, LAG-3, and TIM-3) (n = 6 mice for the CAR alone group and n = 8 mice for the CAR+G6/7R-M452L group). Error bars denote SD. (G) Phospho-STAT3 and STAT5 levels in the CD8+ CAR-T cell population were quantified by flow cytometry (n = 8, unpaired two-tailed Student’s t test). (H) AsPC-1-bearing NSG mice were infused with G6/7R or G6/7R-M452L anti-mesothelin CAR-T cells. CAR-T cells persisting in the spleen were analyzed for Ki-67 expression (n = 8 mice, unpaired two-tailed Student’s t test). (I) Anti-mesothelin G6/7R-M452L CAR-T cells persisting after regression of AsPC-1 were collected from spleen and transplanted into tumor-free NSG mice (n = 9 mice). (J) The frequency of human T cells in the peripheral blood of mice with secondary transplantation was analyzed by flow cytometry (n = 9 mice). (K) Total flux of the luciferase expressed in CAR-T cells was serially monitored by in vivo imaging. For comparison, luciferase-transduced Jurkat cells were transplanted into NSG mice and monitored using the same protocol (n = 9 mice for the CAR-T cell group, and n = 8 mice for the Jurkat group). In (D), (E), (G), (H), (J), and (K), horizontal lines denote mean values. See also Figure S6.
Figure 7
Figure 7
G6/7R-M452L anti-CD19 CAR-T cells can absorb monocyte-derived IL-6 (A) A schematic diagram of the all-in-one vector expressing G6/7R-M452L, anti-CD19 CAR, and IL1R2. (B and C) CAR-T cells coexpressing G6/7R-M452L and IL1R2 were incubated for the indicated periods in the presence of recombinant IL-6 and IL-1β. Concentrations of IL-6 and IL-1β in the culture supernatant were quantified by ELISA (n = 3 cultures; ∗∗p < 0.01, unpaired two-tailed Student’s t test). (D and E) Anti-CD19 CAR-T cells with or without G6/7R and IL1R2 were incubated with NALM-6 and macrophages differentiated from peripheral blood monocytes. Culture supernatant was collected 24 or 48 h after coculture and analyzed for the indicated cytokine concentration by ELISA (E, n = 4 cultures, unpaired two-tailed Student’s t test). Representative data of two experiments. (F) NOG-EXL mice reconstituted with human cord blood cells were infused with CD19-targeting CAR-T cells with or without the indicated cytokine receptors (n = 7–10 mice for each group). Tocilizumab was administered on day 1 when indicated. (G and H) The frequency of CAR-T cells in the peripheral blood (G) and plasma IL-6 levels (H) were analyzed on days 1, 3, 7, and 10 after CAR-T cell infusion (n = 7–10 mice per group, one-way ANOVA with multiple comparison test of the log-transformed values). ∗p < 0.05, ∗∗p < 0.01; NS, not significant. In (E), (G), and (H), horizontal lines denote mean values. See also Figure S7.

References

    1. Maude S.L., Laetsch T.W., Buechner J., Rives S., Boyer M., Bittencourt H., Bader P., Verneris M.R., Stefanski H.E., Myers G.D., et al. Tisagenlecleucel in Children and Young Adults with B-Cell Lymphoblastic Leukemia. N. Engl. J. Med. 2018;378:439–448. doi: 10.1056/NEJMoa1709866. - DOI - PMC - PubMed
    1. Locke F.L., Ghobadi A., Jacobson C.A., Miklos D.B., Lekakis L.J., Oluwole O.O., Lin Y., Braunschweig I., Hill B.T., Timmerman J.M., et al. Long-term safety and activity of axicabtagene ciloleucel in refractory large B-cell lymphoma (ZUMA-1): a single-arm, multicentre, phase 1-2 trial. Lancet Oncol. 2019;20:31–42. doi: 10.1016/s1470-2045(18)30864-7. - DOI - PMC - PubMed
    1. Abramson J.S., Palomba M.L., Gordon L.I., Lunning M.A., Wang M., Arnason J., Mehta A., Purev E., Maloney D.G., Andreadis C., et al. Lisocabtagene maraleucel for patients with relapsed or refractory large B-cell lymphomas (TRANSCEND NHL 001): a multicentre seamless design study. Lancet. 2020;396:839–852. doi: 10.1016/S0140-6736(20)31366-0. - DOI - PubMed
    1. Wang M., Munoz J., Goy A., Locke F.L., Jacobson C.A., Hill B.T., Timmerman J.M., Holmes H., Jaglowski S., Flinn I.W., et al. KTE-X19 CAR T-Cell Therapy in Relapsed or Refractory Mantle-Cell Lymphoma. N. Engl. J. Med. 2020;382:1331–1342. doi: 10.1056/NEJMoa1914347. - DOI - PMC - PubMed
    1. Munshi N.C., Anderson L.D., Jr., Shah N., Madduri D., Berdeja J., Lonial S., Raje N., Lin Y., Siegel D., Oriol A., et al. Idecabtagene Vicleucel in Relapsed and Refractory Multiple Myeloma. N. Engl. J. Med. 2021;384:705–716. doi: 10.1056/NEJMoa2024850. - DOI - PubMed

MeSH terms