. 2024 May 21;5(5):101532.
doi: 10.1016/j.xcrm.2024.101532. Epub 2024 Apr 25.

Targeting PDGF signaling of cancer-associated fibroblasts blocks feedback activation of HIF-1α and tumor progression of clear cell ovarian cancer

Affiliations

Targeting PDGF signaling of cancer-associated fibroblasts blocks feedback activation of HIF-1α and tumor progression of clear cell ovarian cancer

Yutaro Mori et al. Cell Rep Med. .

Abstract

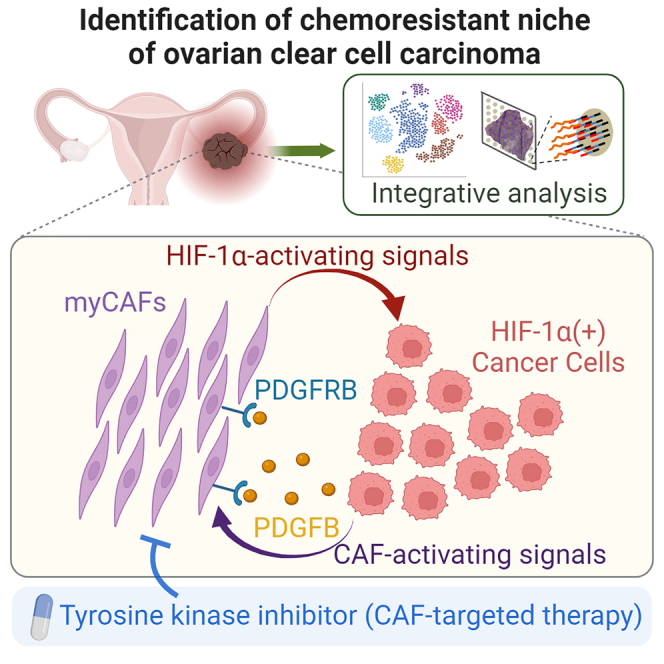
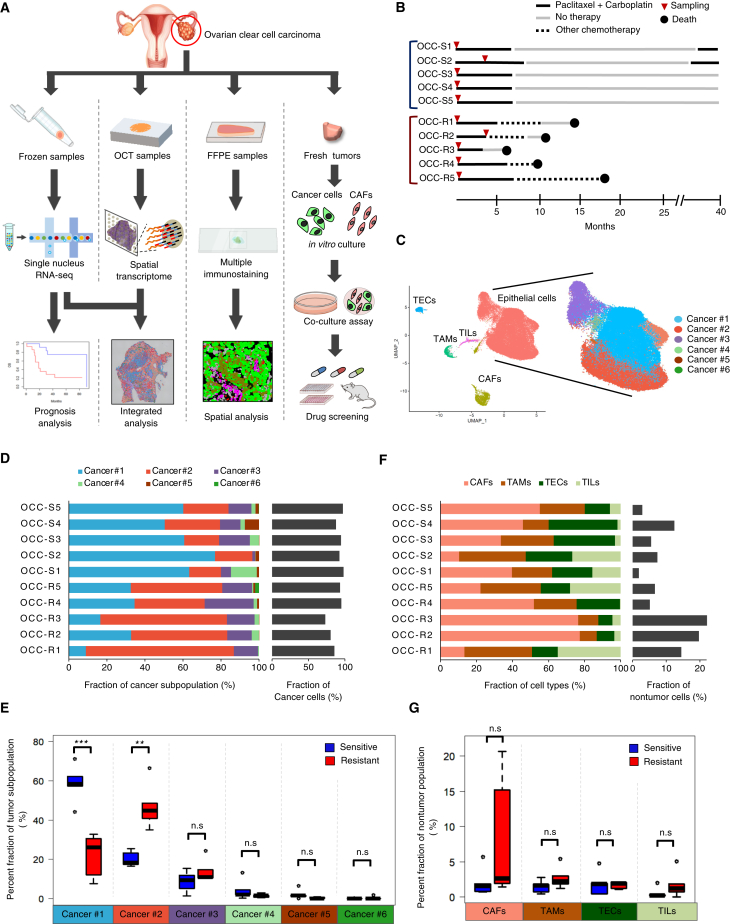
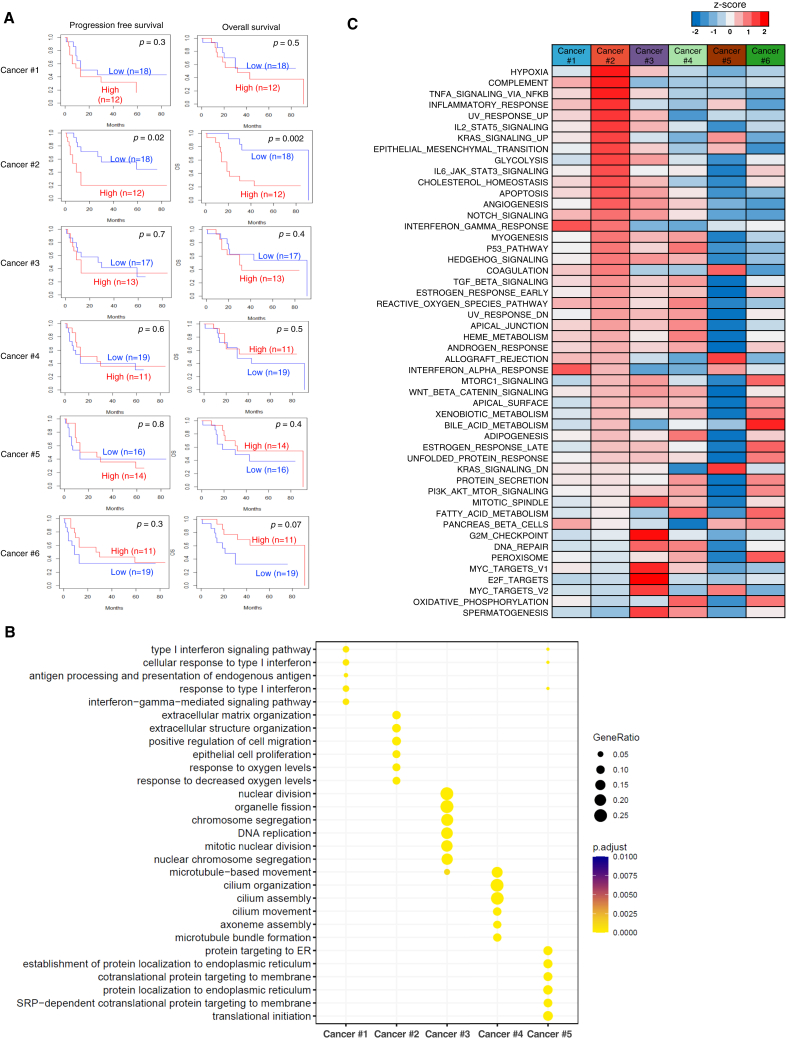
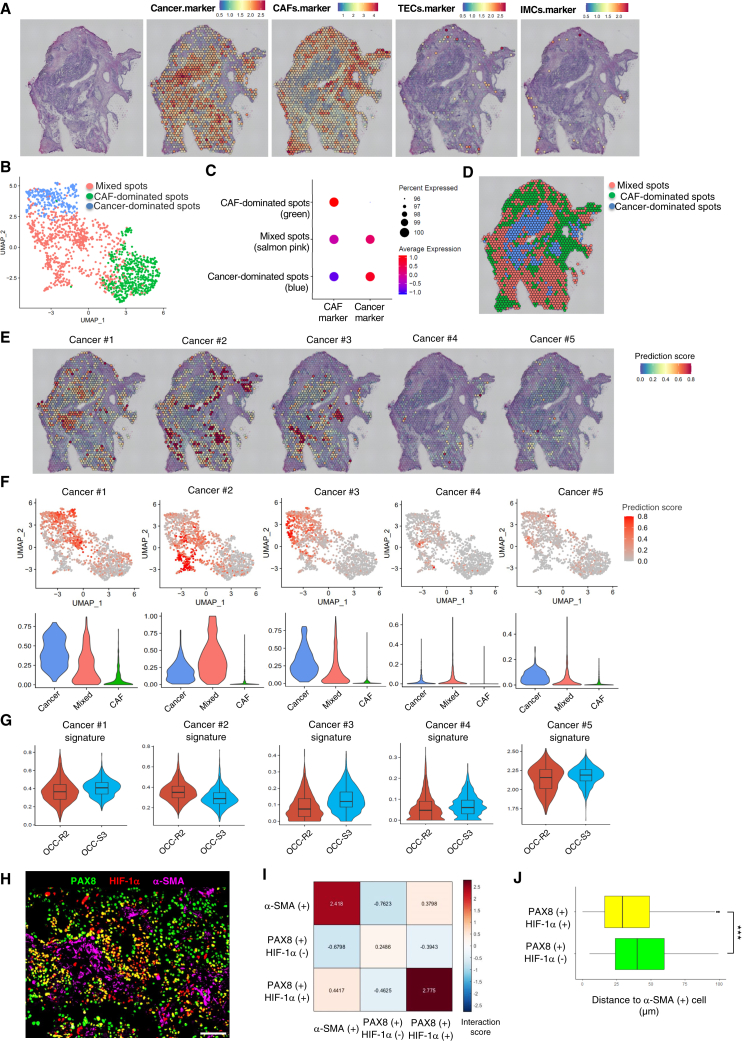
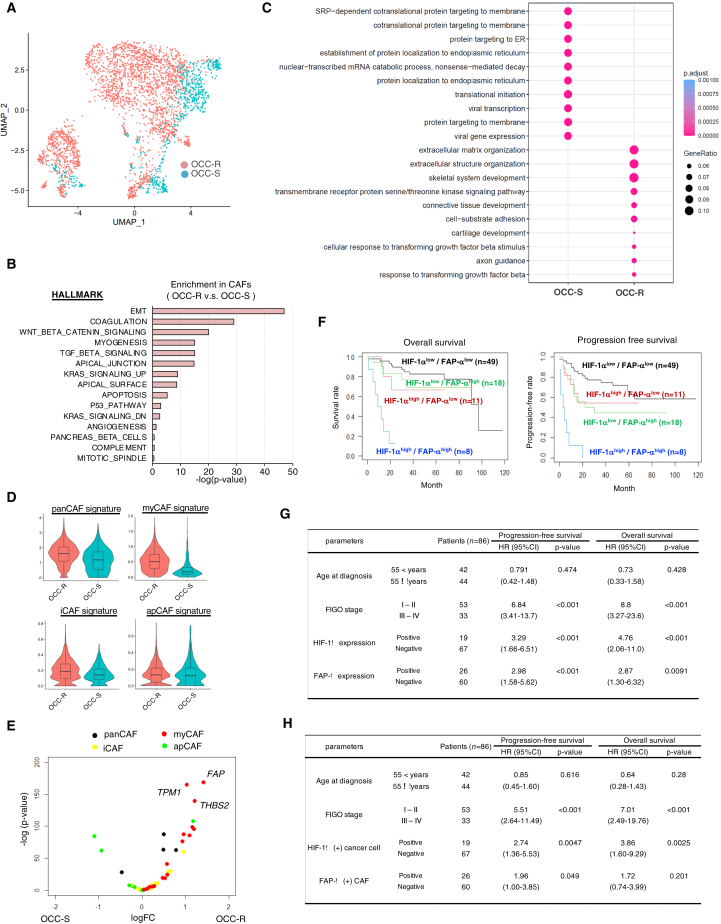
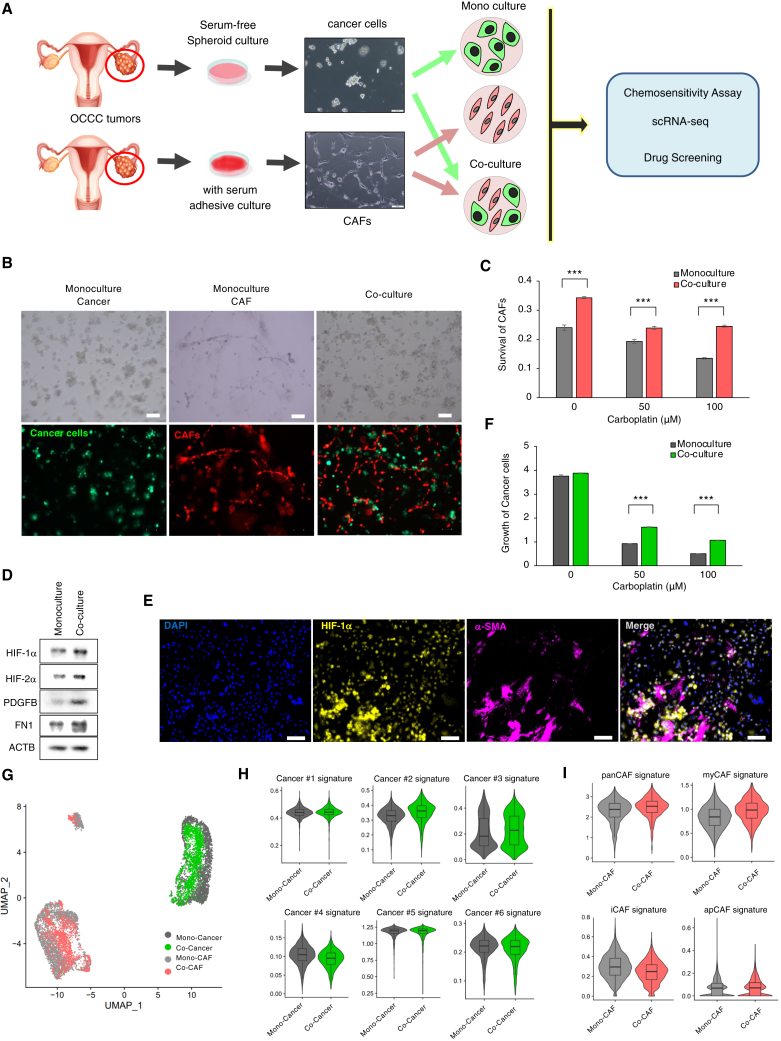
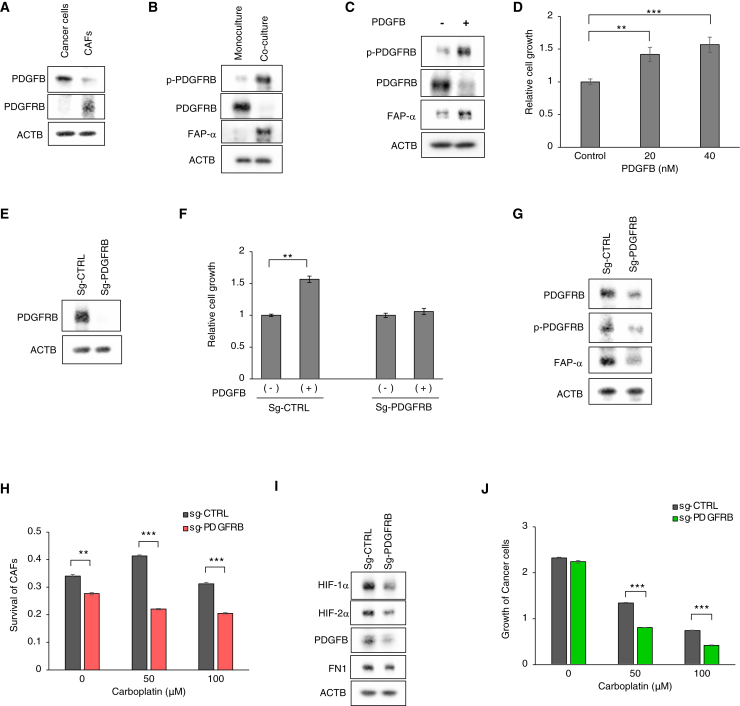
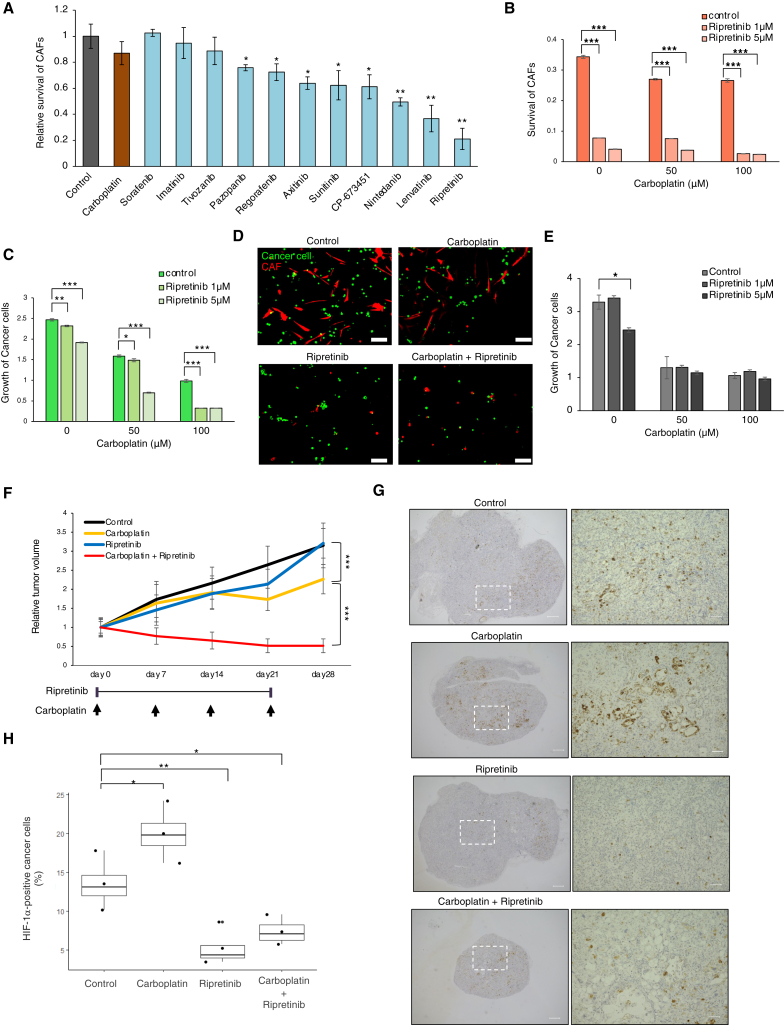
Ovarian clear cell carcinoma (OCCC) is a gynecological cancer with a dismal prognosis; however, the mechanism underlying OCCC chemoresistance is not well understood. To explore the intracellular networks associated with the chemoresistance, we analyze surgical specimens by performing integrative analyses that combine single-cell analyses and spatial transcriptomics. We find that a chemoresistant OCCC subpopulation with elevated HIF activity localizes mainly in areas populated by cancer-associated fibroblasts (CAFs) with a myofibroblastic phenotype, which is corroborated by quantitative immunostaining. CAF-enhanced chemoresistance and HIF-1α induction are recapitulated in co-culture assays, which show that cancer-derived platelet-derived growth factor (PDGF) contributes to the chemoresistance and HIF-1α induction via PDGF receptor signaling in CAFs. Ripretinib is identified as an effective receptor tyrosine kinase inhibitor against CAF survival. In the co-culture system and xenograft tumors, ripretinib prevents CAF survival and suppresses OCCC proliferation in the presence of carboplatin, indicating that combination of conventional chemotherapy and CAF-targeted agents is effective against OCCC.

Keywords: HIF-1α; PDGF; cancer-associated fibroblasts; chemoresistant niche; ovarian clear cell carcinoma.


Conflict of interest statement

Declaration of interests Teikyo University has filed for a patent application on CAF inhibition by tyrosine kinase inhibitors, and K.O. and Y.M. are named as inventors on this patent.

Figures

None
Graphical abstract
Figure 1
Figure 1
Identification of a cancer cell subpopulation associated with chemoresistance of OCCC (A) Study design based on surgical specimens of OCCC. (B) Timeline presentation of 10 patients whose tumors were used for snRNA-seq, spatial transcriptome, and immunostaining analyses. (C) UMAP presentation of snRNA-seq data obtained from chemoresistant (OCC-R1-5) and chemosensitive (OCC-S1-5) OCCC. Original snRNA-seq data from the 10 tumors (Figure S1A) were subjected to anchoring prior to data integration. Subsequently, the identity of cells in each cluster was determined based upon expression of marker genes, as shown in Figure S1C. TEC, tumor endothelial cells; CAF, cancer-associated fibroblast; TAM, tumor-associated macrophage; TIL, tumor-infiltrating lympohcyte. The epithelial tumor population was further classified into six subpopulations (Cancer #1–6), denoted by the indicated colors. (D) Stacked bar graph displaying the distribution of each cancer cell subpopulation (Cancer #1–6) in each tumor (left) and the percentage of cancer cells (right). (E) Boxplots showing the fraction of the indicated cancer subpopulations in the chemoresistant and chemosensitive tumors shown in (D). The horizontal bars within the boxes indicate the median value. The top and bottom bars of the box denote the 25th and 75th percentiles, respectively. ∗∗∗p < 0.001; n.s., not significant. (F) Stacked bar graph displaying the distribution of non-tumor cell populations within each tumor (left) and the percentage of non-tumor cells (right). (G) Boxplots showing the fractions of the indicated non-tumor populations. ∗p < 0.05, ∗∗p < 0.01, ∗∗∗p < 0.001. p values were determined by Student’s t test.
Figure 2
Figure 2
A chemoresistant subpopulation of OCCC is associated with HIF activation and a poor prognosis (A) Kaplan-Meier plots of advanced-stage OCCC (stages II–IV, n = 30). The top 20 genes highly expressed by each cancer subpopulation (Cancer #1–6) were selected as signature genes and used to classify the 30 cases of advanced OCCC (stages II–IV) into groups with high or low expression of signature genes. Kaplan-Meier curves show progression-free survival and overall survival in each group. p values were calculated using log rank test. (B) Dot plot presentation of Gene Ontology (GO) terms specifically enriched in cancer subpopulations (Cancer #1–5). (C) Heatmap of normalized ssGSEA enrichment scores for Hallmark pathways in cancer subpopulations (Cancer #1–6).
Figure 3
Figure 3
HIF-1α-positive chemoresistant cells reside near CAFs in chemoresistant OCCC (A) Far left: H&E staining of OCC-R2 tissue sections. Right: Visium spatial transcriptomics (ST) spots on H&E-stained sections were overlaid with spatial feature plots of ovarian cancer cell markers (EPCAM, PAX8, and KRT7), CAF markers (COL1A1, COL1A2, DCN, and VIM), endothelial cell (TEC) markers (VWF, CDH5, and PECAM1), or an immune cell marker (PTPRC). (B) UMAP plots of the Visium ST spots shown in (A). ST spots were classified into three clusters by unsupervised clustering and are denoted by different colors. (C) Dot plots showing average expression of CAF markers and ovarian cancer cell markers by the indicated clusters. Three clusters shown in (B) were designated as cancer-dominated spots, CAF-dominated spots, and mixed spots, based upon expression of these markers. (D) Spatial presentation of the three cluster in OCC-R2 tissue sections. Tissue localization of the clustered ST spots was visualized and is denoted by the indicated colors. (E) Spatial feature plots of the prediction scores for the indicated cancer subpopulations (Cancer #1–5) in OCC-R2 tissue sections. (F) Top: UMAP feature plots of ST spots of OCC-R2. Prediction scores for the indicated cancer subpopulations are shown in red. Bottom: violin plots of the prediction scores for the cancer subpopulations shown in the top columns. ST spots were classified into three groups as shown in (D), and the prediction scores for each group are presented. (G) Violin plots showing the average expression values for the signature genes expressed by the indicated cancer subpopulations (Cancer #1–5) in ST spots of OCC-R2 and OCC-S3. In the boxplots inside the violin plots, the top and bottom bars of the boxes represent the 25th and 75th percentile, respectively, and the horizontal bars within the box indicate the median value. (H) Representative magnified images of HIF-1α(+) cancer cells near α-SMA(+) CAFs in a chemoresistant tumor (OCC-R3). Scale bar, 100 μm. (I) Nearest-neighbor analysis of the image shown in (H). (J) Boxplot showing the average distance from PAX8(+)/HIF-1α(+) cells or PAX8(+)/HIF-1α(−) cells to the closest α-SMA(+) cell, calculated using the image shown in (H). ∗∗∗p < 0.001. p values were determined by Student’s t test.
Figure 4
Figure 4
CAFs in chemoresistant tumors are associated with myofibroblastic phenotype (A) UMAP plot of CAFs, color-coded as chemoresistant (OCC-R1-5) or chemosensitive (OCC-S1-5) cases. (B) Bar chart showing enrichment of specific biological pathways in CAFs from resistant tumors. Enrichment of a pathway is calculated by comparing the average ssGSEA values of Hallmark gene sets in CAFs from five chemoresistant and five chemosensitive tumors. p values for the top 15 Hallmark terms enriched in CAFs from chemoresistant cases were determined by Student’s t test. ∗∗p < 0.01. (C) Dot plot of biological GO terms upregulated in CAFs from chemoresistant (OCC-R) and chemosensitive (OCC-S) cases. (D) Violin plots of the signature scores for the indicated CAFs from chemoresistant and chemosensitive cases. (E) Volcano plots showing preferential induction of myCAF signature genes in CAFs from chemoresistant cases. Average expression values for the indicated CAF signature genes expressed by CAFs from chemoresistant and chemosensitive cases were calculated, and the relative ratios are shown. The horizontal and vertical axes represent the log10 values of fold changes and p values, respectively. Red dots, myCAF signature genes; yellow dots, iCAF signature genes; green dots: apCAF signature genes; black dots, panCAF signature genes. A list of the signature genes is presented in Table S3. (F) Kaplan-Meier plots of OCCC (stages I–IV, n = 86). The patients were stratified into 4 groups: HIF-1αlow/FAP-αlow (n = 49), HIF-1αhigh/FAP-αlow (n = 11), HIF-1αlow/FAP-αhigh (n = 18), and HIF-1αhigh/FAP-αhigh (n = 8). Kaplan-Meier curves of progression-free survival and overall survival in each group are shown. (G and H) Association of HIF-1α and FAP-α expression with poor prognosis. Association of the indicated parameters with progression-free survival or overall survival was evaluated by univariate (G) and multivariate (H) analyses (86 cases of OCCC). Hazard ratios (HRs), 95% confidence intervals, and p values were calculated with Cox’s proportional hazards regression model. ∗∗∗p < 0.001.
Figure 5
Figure 5
Co-cultivation of CAFs with chemoresistant OCCC cells recapitulates the chemoresistant niche in vitro (A) Experimental design of the in vitro co-culture system. Cancer spheroid cells and CAFs were derived from surgical specimens of HIF-1α-positive OCCC. The established cancer cells and CAFs were labeled with GFP/Luc2 and mCherry/hRluc, respectively; cultivated either alone or in combination; and subjected to a chemosensitivity assay, scRNA-seq, or drug screening. (B) Bright-phase images (top) and fluorescence images (bottom) of the indicated cells cultivated under organoid conditions for 7 days. Scale bars, 100 μm. (C) Survival of CAFs upon monoculture or co-culture with cancer cells (OVN-48) for 7 days. Cultured cells were grown in the absence or presence of the indicated concentrations of carboplatin, and cell survival was evaluated by measuring hRLuc activity. The data are presented as mean ± SD (n = 3). p values were determined by Student’s t test. ∗∗∗p < 0.001. (D) Western blot analyses of cancer cells that were sorted by fluorescence-activated cell sorting (FACS) after incubation under monoculture or co-culture conditions for 3 days. (E) Representative image of immunostaining of HIF-1α and α-SMA in cancer cells and CAFs co-cultured for 3 days. Scale bars, 100 μm. (F) Cancer cell growth (OVN-48) upon monoculture or co-culture with CAFs for 7 days. Cultured cells were grown in the absence or presence of the indicated concentrations of carboplatin, and cancer cell proliferation was evaluated by measuring Luc2 activity (n = 3). ∗∗∗p < 0.001. (G) UMAP plot of scRNA-seq data from cancer cells (OVN-48) and CAFs incubated under monoculture and co-culture conditions for 3 days. (H) Violin plots of the signature scores for the cancer subpopulations (Cancer #1–6) grown under the monoculture and co-culture conditions in (G). (I) Violin plots of the indicated signature genes in CAFs grown under the monoculture and co-culture conditions shown in (G). Statistically significant differences are indicated: ∗∗∗p < 0.001.
Figure 6
Figure 6
CAF activation by cancer-derived PDGF mediates chemoresistance and HIF-1α activation of cancer cells (A) Western blot analysis of GFP-labeled cancer cells (OVN-48) and mCherry-labeled CAFs with the indicated antibodies. (B) Western blot analysis of CAFs, grown under monoculture or co-culture conditions for 3 days with the indicated antibodies. Note that a PDGFRB level was reduced under co-culture conditions, presumably via negative feedback regulation. (C) Western blot analyses of CAFs treated with 40 nM PDGFB for 3 days. (D) Relative growth of CAFs treated with different concentrations of PDGFB for 7 days. The data are presented as mean ± SD (n = 3). p values were determined by Student’s t test. ∗∗p < 0.01, ∗∗∗p < 0.001. (E) Western blot analyses of CAFs subjected to Cas9/CRIPSR-mediated knockout with the indicated sgRNAs. (F) Relative growth of CAFs transduced with the indicated sgRNA and then treated with 20 nM of PDGFB for 7 days. The data are presented as mean ± SD (n = 3). p values were determined by Student’s t test. Statistically significant differences are indicated. ∗∗p < 0.01. (G) Western blot analyses of control and PDGFRB-deficient CAFs that were FACS-sorted on mCherry after incubation with cancer cells for 3 days. (H) Survival of control and PDGFRB-deficient CAFs that were incubated with cancer cells for 7 days (n = 3). ∗∗p < 0.01, ∗∗∗p < 0.001. (I) Western blot analysis of cancer cells that were FACS-sorted on GFP after incubation for 3 days with control or PDGFRB-deficient CAFs. p values were determined by Student’s t test. Statistically significant differences are indicated: ∗∗p < 0.01, ∗∗∗p < 0.001. (J) Proliferation of cancer cells cultured for 7 days with control or PDGFRB-deficient CAFs in the presence of the indicated concentrations of carboplatin (n = 3). ∗∗∗p < 0.001.
Figure 7
Figure 7
CAF inhibition by ripretinib blocks growth of OCCC in combination with carboplatin (A) Inhibition of CAFs cultured for 7 days grown on attachment culture conditions in the presence of the indicated TKIs or carboplatin (1 μM). The data are presented as mean ± SD (n = 3). p values were determined by Student’s t test. Statistically significant differences are indicated: ∗p < 0.05, ∗∗p < 0.01. (B) Inhibition of CAFs by ripretinib. CAFs co-cultured with cancer cells under co-culture conditions were treated with the indicated concentrations of ripretinib and carboplatin for 7 days (n = 3). ∗∗∗p < 0.001. (C) Co-operative inhibition of the growth of co-cultivated cancer cells (OVN-48) by ripretinib and carboplatin. Cancer cells co-cultured with CAFs were treated for 7 days with the indicated concentrations of ripretinib and carboplatin. (D) Fluorescence images of cancer cells and CAFs co-cultured for 7 days in the presence or absence of 100 μM carboplatin and/or 5 μM ripretinib. Scale bars, 100 μm. (E) Cancer cells grown under monoculture conditions were treated with the indicated concentrations of ripretinib and carboplatin for 7 days (n = 3). ∗p < 0.05. (F) Xenografted tumors (OVN-48, 49 days after co-transplantation of cancer cells and CAFs) were treated with the indicated combinations of carboplatin and/or ripretinib, and tumor volume (mean ± standard error of the mean) was measured weekly (n = 8). ∗∗∗p < 0.001. (G) Immunostaining of xenograft tumors (78 days post transplantation) with HIF-1α. Magnified images are shown on the right. Scale bars, 500 μm (right) and 100 μm (left). (H) Boxplots showing the percentage fraction of HIF-1α-positive cancer cells in the tumor tissues shown in (G). Average values ± SEM are shown. p values were determined by Student’s t test. Statistically significant differences are indicated: ∗p < 0.05, ∗∗p < 0.01, ∗∗∗p < 0.001.

References

    1. Marusyk A., Janiszewska M., Polyak K. Intratumor Heterogeneity: The Rosetta Stone of Therapy Resistance. Cancer Cell. 2020;37:471–484. doi: 10.1016/j.ccell.2020.03.007. - DOI - PMC - PubMed
    1. Chen Y., McAndrews K.M., Kalluri R. Clinical and therapeutic relevance of cancer-associated fibroblasts. Nat. Rev. Clin. Oncol. 2021;18:792–804. doi: 10.1038/s41571-021-00546-5. - DOI - PMC - PubMed
    1. Sahai E., Astsaturov I., Cukierman E., DeNardo D.G., Egeblad M., Evans R.M., Fearon D., Greten F.R., Hingorani S.R., Hunter T., et al. A framework for advancing our understanding of cancer-associated fibroblasts. Nat. Rev. Cancer. 2020;20:174–186. doi: 10.1038/s41568-019-0238-1. - DOI - PMC - PubMed
    1. Lim B., Lin Y., Navin N. Advancing Cancer Research and Medicine with Single-Cell Genomics. Cancer Cell. 2020;37:456–470. doi: 10.1016/j.ccell.2020.03.008. - DOI - PMC - PubMed
    1. Rozenblatt-Rosen O., Regev A., Oberdoerffer P., Nawy T., Hupalowska A., Rood J.E., Ashenberg O., Cerami E., Coffey R.J., Demir E., et al. The Human Tumor Atlas Network: Charting Tumor Transitions across Space and Time at Single-Cell Resolution. Cell. 2020;181:236–249. doi: 10.1016/j.cell.2020.03.053. - DOI - PMC - PubMed

MeSH terms

Substances