. 2024 May 7;36(5):1030-1043.e7.
doi: 10.1016/j.cmet.2024.04.003. Epub 2024 Apr 25.

TM7SF3 controls TEAD1 splicing to prevent MASH-induced liver fibrosis

Affiliations

TM7SF3 controls TEAD1 splicing to prevent MASH-induced liver fibrosis

Roi Isaac et al. Cell Metab. .

Abstract

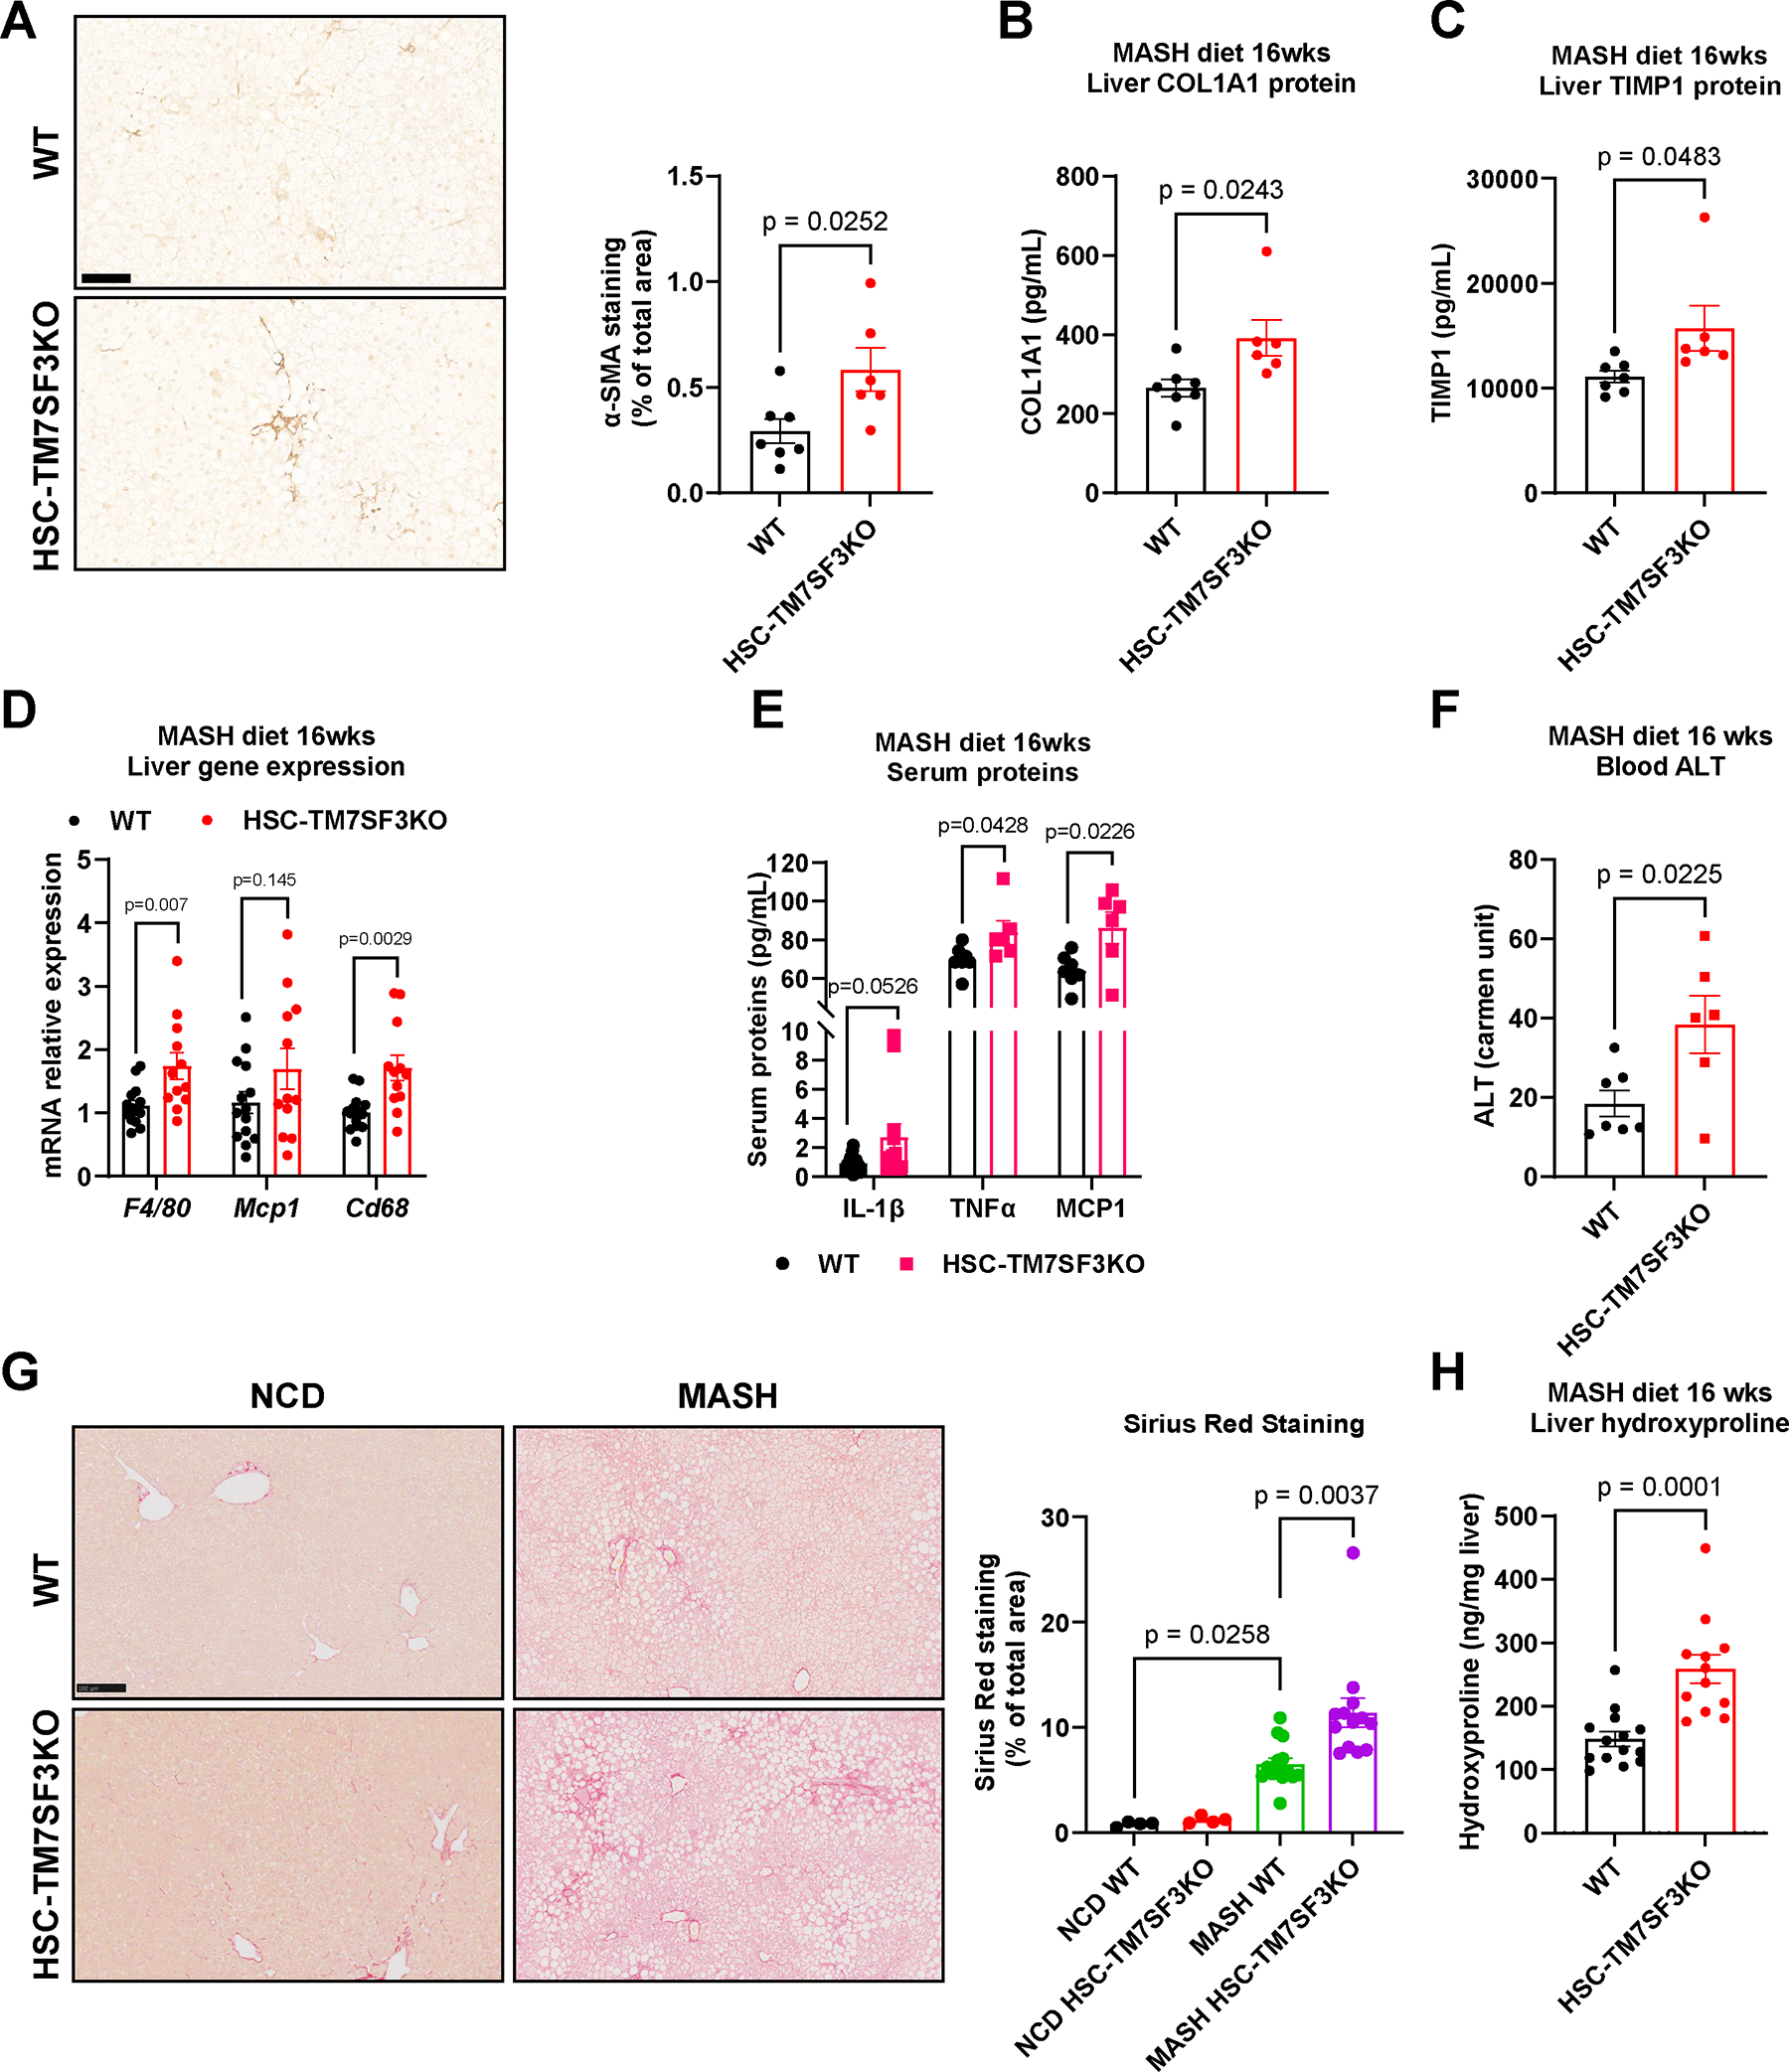
The mechanisms of hepatic stellate cell (HSC) activation and the development of liver fibrosis are not fully understood. Here, we show that deletion of a nuclear seven transmembrane protein, TM7SF3, accelerates HSC activation in liver organoids, primary human HSCs, and in vivo in metabolic-dysfunction-associated steatohepatitis (MASH) mice, leading to activation of the fibrogenic program and HSC proliferation. Thus, TM7SF3 knockdown promotes alternative splicing of the Hippo pathway transcription factor, TEAD1, by inhibiting the splicing factor heterogeneous nuclear ribonucleoprotein U (hnRNPU). This results in the exclusion of the inhibitory exon 5, generating a more active form of TEAD1 and triggering HSC activation. Furthermore, inhibiting TEAD1 alternative splicing with a specific antisense oligomer (ASO) deactivates HSCs in vitro and reduces MASH diet-induced liver fibrosis. In conclusion, by inhibiting TEAD1 alternative splicing, TM7SF3 plays a pivotal role in mitigating HSC activation and the progression of MASH-related fibrosis.

Keywords: ASO; Hippo pathway; MASH; NASH; TEAD1; TM7SF3; alternative splicing; fibrosis; hepatic stellate cells.


Conflict of interest statement

Declaration of interests R.I. and J.M.O. are co-inventors on a provisional patent for the use of ASO 56 as an inhibitor of liver fibrosis.

Figures

Fig. 1.
Fig. 1.. TM7SF3 KO in HSCs induces fibrogenesis in liver organoids and HSCs by promoting activation and cell proliferation.
(A) Mice were fed with the MASH diet for 20 weeks, and Tm7sf3 and Acta2 mRNA levels from isolated HSCs were measured by qPCR (n=5). (B-E) WT hepatocytes, and NPCs were assembled to form liver organoids, together with either WT or inducible whole-body TM7SF3 KO HSCs as indicated (B). The liver organoids were then treated with a MASH-inducing cocktail for 14 days, and relative gene expression (C), protein levels (D), and secreted proteins (E) were measured by qPCR and ELISA for protein. (F, G) Relative gene expression in primary mouse (F) and human (G) HSCs transfected with siRNA against TM7SF3. (H, I) As described in 1F, Ki67 mRNA levels were measured (H), and HSCs were immuno-stained for Ki67 protein (green) and DAPI (blue); the bar graph shows Ki67 staining quantitation (I). Data are represented as mean ± SEM from 3 independent experiments in triplicate/ duplicate; D - two experiments in triplicate; Col3a1 (D, E), and Des (G) – one experiment in triplicate. An unpaired Mann-Whitney U test with a two-tailed distribution was performed. For C-E, one-way ANOVA test followed by Tukey’s multiple comparisons tests, was used; the scheme was created with BioRender.com. See also Figure S1.
Fig. 2.
Fig. 2.. HSC-specific TM7SF3 KO exacerbates MASH-induced liver fibrosis.
Eight-week-old WT and HSC-TM7SF3KO mice were fed WD for 16 weeks. (A) IHC of liver sections for α–SMA. The bar graph represents the quantitation of % stained area (Scale bar – 100 μM). (B, C) ELISA measured liver protein levels of COL1A1 and TIMP1. (D) Relative expression of the indicated genes. (E) ELISA measured serum proteins, IL-1β, TNFα, and MCP1. (F) Serum ALT levels. (G) Sirius Red staining of liver sections from WT and HSC-TM7SF3KO mice fed with NCD or MASH diet. The bar graph represents the quantitation of % stained area (Scale bar – 100 μM). (H) Hydroxyproline assay to measure liver collagen levels. Data are represented as mean + SEM. WT=14; KO=12; for panels A-C, F, WT=7, KO=6; E, TNFα, and MCP1, n=6; H, (NCD), n=4. An unpaired Mann-Whitney U test with two-tailed distribution was performed for WT and KO; for G, one-way ANOVA test followed by Tukey’s multiple comparisons tests was used. See also Figures S2,3.
Fig. 3.
Fig. 3.. TM7SF3 regulates HSC activation by modulation of TEAD1 alternative splicing.
(A) RNA-seq of human liver samples, shows enhanced TEAD1 exon 5 skipping in MASH patients (Normal=4; MASLD=11; MASH=14). (B) Quantitation of % TEAD1 exon 5 skipping in liver cells from mice fed NCD or MASH diet for 5 months (n=4). (C, D) PCR of TEAD1 exon 5 splicing in U2-OS cells and human HSCs transfected with siTM7SF3 and quantification (C; + Exon 5 inclusion, - exclusion). (E) A customized siRNA was designed to silence only the active form of TEAD1. (F) PCR of TEAD1 splicing in human HSCs transfected with the indicated siRNAs. (G) Quantitation of PCR products from 3F. (H-K) Silencing of TM7SF3 in human HSCs with or without co-silencing the active form of TEAD1 (siTEAD1ΔEx5). The cells were treated with TGFβ for 24h. mRNA expression of Ctgf (H), Cyr61 (I), Acta2 (α–SMA) (J), and Il-6 (K) was measured by qPCR analysis. (L, M) Mouse liver organoids were transfected with siTEAD1ΔEx5, and fibrogenic markers were detected by qPCR (L) and ELISA (M). (N) As in 3H, cell proliferation was measured by WST-1 assay (see methods). Data are represented as mean + SEM from 3 independent experiments in triplicate/duplicate; G, I, M- two experiments in triplicate; Il-6 (K) and Col3a1 (L, M) - one experiment. A one-way ANOVA test followed by Tukey’s multiple comparisons was used. An unpaired Mann-Whitney U test with two-tailed distribution was used for panels B, D, L, M (Acta2 and Bambi in L - one-tailed). See also Figure S4.
Fig. 4.
Fig. 4.. TM7SF3 inhibits TEAD1 alternative splicing via the hnRNPU splicing factor.
(A) List of potential splicing factors with a binding motif on the introns 100bp up or downstream of the TEAD1 spliced exon 5. (B) Design of primers for RNA-Immunoprecipitation (RIP). (C-E) RNA-IP in human HSCs (C) and HSCs transfected with siRNA-hnRNPU (D) or siRNA-TM7SF3 (E) with the indicated antibodies. After incubation with antibodies, RNA was eluted, and PCR was performed. (F-I) TM7SF3 was silenced by siRNA with or without co-silencing of hnRNPU in human HSCs. The cells were treated with TGFβ for 24h, and full-length TEAD1 and TEAD1ΔEx5 measured by PCR. (F) PCR of TEAD1 splicing; and TEAD1 exon 5 skipping quantification (G); mRNA expression of the indicated genes was detected by qPCR analysis (H, I). (J) Scheme of the model by which TM7SF3 regulates TEAD1 AS. TM7SF3 associates with hnRNPU and inhibits its activity to promote TEAD1 exon 5 skipping (J:b); J:a, When TM7SF3 is depleted, hnRNPU is no longer inhibited and TEAD1ΔEx5 is increased. (K) In similar experimental conditions as described in Fig. 3F, cell proliferation was assessed by Ki67 FACS immunostaining. Data are represented as mean ± SEM of 3 independent experiments in duplicate. D-G, K are from 2 experiments. A one-way ANOVA test followed by Tukey’s multiple comparison tests was used. The scheme was created with BioRender.com. See also Figure S5.
Fig. 5.
Fig. 5.. ASO targeting TEAD1 pre-mRNA deactivates HSCs.
(A) Antisense oligomer (ASO) was designed to bind to TEAD1 pre-mRNA and block the binding of hnRNPU. (B) Human HSCs were transfected with the ASO for 48h and treated with TGFβ for 24h. mRNA expression of the indicated genes was detected by qPCR analysis. (C-E) Mouse Liver organoids were transfected with ASO 56, and fibrogenic markers were detected by qPCR (C), cellular protein expression (D), and secreted proteins by ELISA (E). (F, G) Mice were injected with a single IV dose (10 mg/Kg) of ASO 56, and 7 days later, hepatocytes, NPCs, and HSCs were isolated by pronase/collagenase perfusion. RNA was extracted from cells, and TEAD1ΔEx5 (F) and Cyr61 gene expression (G) were measured by qPCR analysis (n=9; HSCs, ASO Control n=8, ASO 56 n=7). (H-J) Mouse HSCs (H), hepatocytes (I), and NPCs (J) were transfected with the ASO 56 for 48h and treated with TGFβ for 24h. mRNA expression of the indicated genes was detected by qPCR analysis. Data are represented as mean ± SEM of 3–4 experiments in triplicate/duplicate; C, D, E, J -two independent experiments; Bambi and Col3a1 – one experiment. A one-way ANOVA test followed by Tukey’s multiple comparisons was used. An unpaired Mann-Whitney U test was used for panels (C-E). The scheme was created with BioRender.com. See also Figure S6.
Fig. 6.
Fig. 6.. ASO targeting TEAD1 pre-mRNA deactivates HSCs in vivo with anti-MASH effects.
(A) Scheme for ASO treatment protocol of WT mice fed a Western diet for six months. (B-I) After two months of ASO IV injections, livers were removed, and markers of fibrogenic genes were detected by qPCR and protein analysis. (B) Relative gene expression of TAZ, CTGF, and Birc5. (C) Western blot of CTGF. (D) Bar graph of CTGF immunoblot densitometry, normalized to β-actin. (E) Relative gene expression of TNFα. (F-G) Western blot of IL-1β, PDGFRβ and α–SMA. (H) Bar graph of IL-1β, PDGFRβ, and α–SMA immunoblot densitometry, normalized to β-actin. (I) Timp1 protein detection by ELISA. (J) Blood ALT levels. (K) Liver sections with β-galactosidase staining (Scale bar – 100 μM). (L) Liver sections were stained with Sirius red for fibrosis detection (Scale bar – 250 μM). (M) Liver collagen levels were measured by hydroxyproline assay. Data are represented as mean ± SEM; In B, E, J, L, M data represents a meta-analysis of 2 cohorts, NCD n=8; MASH ASO CON and 56 n=16. In all the others NCD n=4; MASH ASO CON and 56 n=12 from 2 cohorts. A one-way ANOVA test followed by Tukey’s multiple comparisons tests was used. See also Figure S6.

References

    1. Yeh ML, and Yu ML (2023). From nonalcoholic steatohepatitis, metabolic dysfunction-associated fatty liver disease, to steatotic liver disease: Updates of nomenclature and impact on clinical trials. Clin Mol Hepatol 29, 969–972. 10.3350/cmh.2023.0359. - DOI - PMC - PubMed
    1. Benedict M, and Zhang X (2017). Non-alcoholic fatty liver disease: An expanded review. World J Hepatol 9, 715–732. 10.4254/wjh.v9.i16.715. - DOI - PMC - PubMed
    1. Vieira Barbosa J, and Lai M (2021). Nonalcoholic Fatty Liver Disease Screening in Type 2 Diabetes Mellitus Patients in the Primary Care Setting. Hepatol Commun 5, 158–167. 10.1002/hep4.1618. - DOI - PMC - PubMed
    1. Godoy-Matos AF, Silva Junior WS, and Valerio CM (2020). NAFLD as a continuum: from obesity to metabolic syndrome and diabetes. Diabetol Metab Syndr 12, 60. 10.1186/s13098-020-00570-y. - DOI - PMC - PubMed
    1. Zisser A, Ipsen DH, and Tveden-Nyborg P (2021). Hepatic Stellate Cell Activation and Inactivation in NASH-Fibrosis-Roles as Putative Treatment Targets? Biomedicines 9. 10.3390/biomedicines9040365. - DOI - PMC - PubMed

Publication types

MeSH terms