. 2024 Jul 11;73(8):1321-1335.
doi: 10.1136/gutjnl-2023-329807.

Axon guidance cue SEMA3A promotes the aggressive phenotype of basal-like PDAC

Affiliations

Axon guidance cue SEMA3A promotes the aggressive phenotype of basal-like PDAC

Francesca Lupo et al. Gut. .

Abstract

Objective: The dysregulation of the axon guidance pathway is common in pancreatic ductal adenocarcinoma (PDAC), yet our understanding of its biological relevance is limited. Here, we investigated the functional role of the axon guidance cue SEMA3A in supporting PDAC progression.

Design: We integrated bulk and single-cell transcriptomic datasets of human PDAC with in situ hybridisation analyses of patients' tissues to evaluate SEMA3A expression in molecular subtypes of PDAC. Gain and loss of function experiments in PDAC cell lines and organoids were performed to dissect how SEMA3A contributes to define a biologically aggressive phenotype.

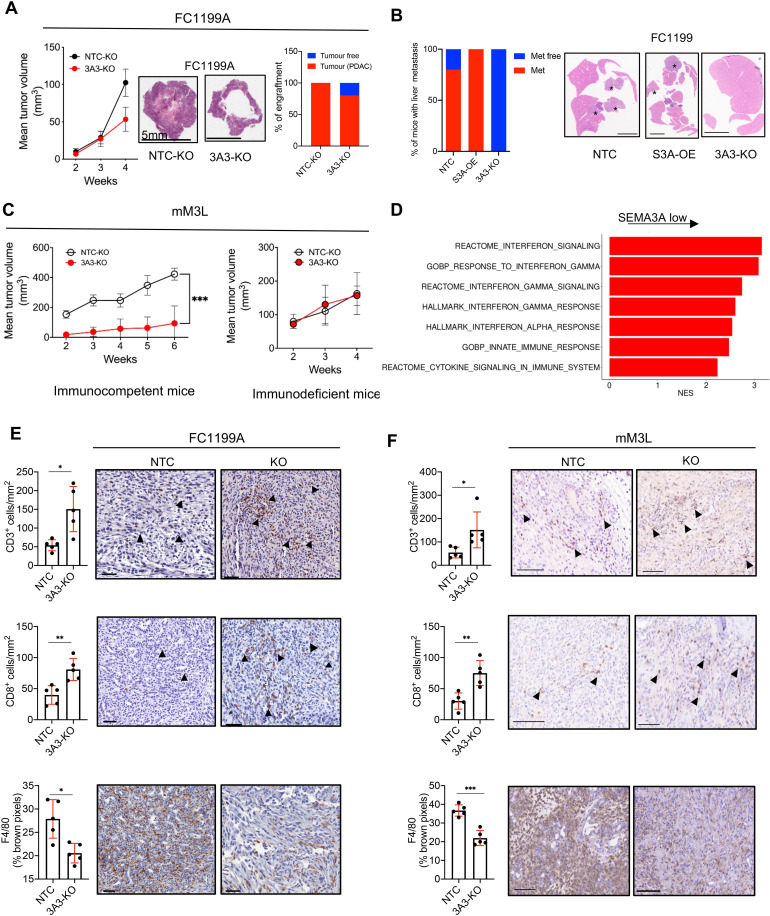
Results: In PDAC tissues, SEMA3A is expressed by stromal elements and selectively enriched in basal-like/squamous epithelial cells. Accordingly, expression of SEMA3A in PDAC cells is induced by both cell-intrinsic and cell-extrinsic determinants of the basal-like phenotype. In vitro, SEMA3A promotes cell migration as well as anoikis resistance. At the molecular level, these phenotypes are associated with increased focal adhesion kinase signalling through canonical SEMA3A-NRP1 axis. SEMA3A provides mouse PDAC cells with greater metastatic competence and favours intratumoural infiltration of tumour-associated macrophages and reduced density of T cells. Mechanistically, SEMA3A functions as chemoattractant for macrophages and skews their polarisation towards an M2-like phenotype. In SEMA3Ahigh tumours, depletion of macrophages results in greater intratumour infiltration by CD8+T cells and better control of the disease from antitumour treatment.

Conclusions: Here, we show that SEMA3A is a stress-sensitive locus that promotes the malignant phenotype of basal-like PDAC through both cell-intrinsic and cell-extrinsic mechanisms.

Keywords: PANCREATIC CANCER.


Conflict of interest statement

Competing interests: None declared.

Figures

Figure 1
Figure 1
Cell intrinsic and cell extrinsic inputs eliciting SEMA3A expression in PDAC cells. (A) Boxplot of SEMA3A, SEMA3C, SEMA3F and SEMA4G Z-scores stratified by the Moffitt subtypes in the ICGC, and the PanCuRx cohorts. **p<0.01, ***p<0.001, ****p<0.0001 by Student’s t-test. (B) Heatmap showing correlation (Spearman’s correlation) between the indicated semaphorins and basal-like/squamous associated gene programmes in the ICGC cohort. GP2 and GP3 refers to the core gene programmes defining the squamous subtype in Bailey et al. All annotated boxes, p<0.05. (C) Upper panel, immunoblot analysis of p63, SEMA3A and SEMA3C in whole cell lysates of different human pancreatic cancer cell lines. Lower panel, immunoblot analysis of SEMA3A and SEMA3C in whole cell lysates of primary tumour organoids ordered based on their basal-like identity (from left to right increasing basalness). GAPDH, loading control. (D) Immunoblot analysis of p63, SEMA3A and SEMA3C in whole cell lysates from BxPC3 (left) and MiaPaCa2 (right) squamous cell lines transfected with either non-targeting control (NTC) of siRNA targeting p63. GAPDH as loading control. (E) Left panel, immunoblot analysis of SEMA3A and SEMA3C in whole cell lysates from mT6 treated with vehicle or Nutlin-3A (see the ‘Methods’ section). GAPDH, loading control. Changes in the expression (qPCR) or secretion (ELISA) of SEMA3A were detected in mT6 following Nutlin-3A treatment (right panel). (F) Immunoblot analysis of p63 and SEMA3A in KPC 2D cell lines (FC1199) transduced with either an empty vector (NTC) or a p63 ORF. On the right, anti-p63 ChIP-qPCR analysis of seven different genomic regions upstream of the promoter of Sema3a. The ChIP-qPCR signal of each sample was normalised to its own input. (G) qPCR showing changes in the expression of Sema3a (left) and Sema3c (right) relative to the reduced media condition (RM, without A83-01 and mNoggin) in three different tumour organoid cultures treated as indicated. Data are mean of three technical replicates. ****p<0.0001, **p<0.01, *p<0.05 by unpaired Student’s t-test. (H) Immunoblot analysis of SEMA3A in whole cell lysates from SMAD4 proficient and deficient mT6 organoids that were treated with either vehicle or TGF-β1 for 48 hours. β-actin was used as loading control (left panel). qPCR analysis (right panel) of SEMA3a in mT6 organoids treated as indicated. ***p<0.001 by Student’s t-test. (I) Changes in the expression of Ctgf, Sema3a and Sema3c in mouse tumour organoids (n=2) grown on substrate of increasing rigidity for 48 hours. Data are represented as mean value±SD (n=3 technical replicates). *p<0.05, ***p<0.001, ****p<0.0001 by Student’s t-test. (J) Changes in the expression levels of Sema3c, Sema3a and Vegf in mouse tumour organoids cultivated under different O2 concentration for 24 hours. Results are shown as mean±SD of four independent experiments. ***p<0.001, **p<0.01, *p<0.05 by Student’s t-test. GAPDH, glyceraldehyde 3-phosphate dehydrogenase.
Figure 2
Figure 2
SEMA3A expression is selectively enriched in basal-like PDAC. (A) Violin plots of the normalised expression of SEMA3A in each annotated cell cluster from the integration of four different scRNA-Seq datasets of normal pancreatic tissues (see the ‘Methods’ section). (B) Representative ISH images showing rare SEMA3A (green) and PLXNA1 (red) signals in acinar cells (left panel), islet cells (middle panel) and ductal cells (right panel). Scale bar, 50 µm. Insets show magnification of selected areas with visible signals for SEMA3A (black arrowheads) or PLXNA1 (red arrowheads). (C) Violin plots of the normalised expression of SEMA3A in each annotated cell cluster from the integration of 4 different scRNA-Seq datasets of pancreatic cancer tissues (see the ‘Methods’ section). (D) Epithelial and fibroblasts expression of SEMA3A in individual cells from PDAC cases almost exclusively composed by either classical or basal-like cells (see online supplemental figure S2H). ****p<0.0001 and ns, not significant by Wilcoxon and Mann-Whitney. (E) Left panel, representative ISH images showing expression of SEMA3A in the epithelial (CK18+) and stromal (CK18−) compartment of a pancreatic cancer tissue subdomain classified as classical based on expression of GATA6. Right panel, representative ISH images showing expression of SEMA3A in the epithelial and stromal compartment of a tumour area classified as basal-like based on the expression of S100A2 and lack of GATA6 expression. Scale bars as indicated. Quantification is provided as percentage of positive cells (see also online supplemental figure S3B) in the selected area. ****p<0.0001 by unpaired Student’s t-test. ISH, in situ hybridisation.
Figure 3
Figure 3
SEMA3A promotes the activation of PI3K/Akt in mouse pancreatic ductal adenocarcinoma (PDAC) cells. (A–C) Immunoblot analyses of SEMA3A in whole cell lysates from mouse tumour (mT6) organoids, mouse metastatic (mM3L) organoids and KPC 2D cell lines (FC1199 and FC1245) following either overexpression (OE) or genetic knockout (KO); GAPDH was used as loading control in A and B while β-actin was used in C. (D–F) Proliferation (as total luminescence) measured over the course of 7 days of either cell lines or organoid cultures from A to C. The suffix L for mM3 denotes that the culture was established from a liver metastasis. The suffixes A and B for FC1199 and FC1245 denote clonal populations displaying high and low levels of SEMA3A, respectively. NTC or CTR denotes cultures stably transduced with a mock control. (G) Immunoblot analyses of the indicated proteins in whole cell lysates from mouse organoid cultures (mT6 and mM3L) cultivated in either organoid medium or in minimal medium. GAPDH was used as loading control. (H) Bar plots showing the quantification of changes in the phosphorylated levels of p-AKT as relative density of the total protein level. Data are presented as means±SD of three biological replicates. ****p<0.0001, **p<0.01, *p<0.05 by Student’s t-test corrected for multiple comparison using the Holm-Sidak method. (I) Immunoblot analyses of the indicated proteins in whole cell lysates from mouse pancreatic cancer cell lines following either overexpression (OE) or genetic knockdown (KO) of SEMA3A. GAPDH was used as loading control. (J) Bar plots showing the quantification of changes in the phosphorylated levels of p-AKT as relative density of the total protein level. Data re presented as means±SD of three biological replicates. **p<0.01, *p<0.05 by Student’s t-test corrected for multiple comparison using the Holm-Sidak method. GAPDH, glyceraldehyde 3-phosphate dehydrogenase.
Figure 4
Figure 4
SEMA3A promotes anoikis resistance and increases lung metastases. (A) Representative photographs of the wound area taken immediately after (0), 8 and 24 hours after the incision for FC1199A and B cell lines stably transduced with either non-targeting or control vectors (NTC, CTR), SEMA3A ORF (OE) or gRNAs targeting SEMA3A (KO). FC1199A NTC and KO cells were also treated with recombinant SEMA3A. The experiment was performed in quadruplicate. (B) Representative immunofluorescence images of the anoikis assay (see methods) performed on poly-HEMA coated plate for mM3L NTC and KO treated vehicle (Control), with a RhoK inhibitor (Y-27632), or with recombinant SEMA3A (S3A-FC). Scale bars, 100 µm. Quantification of four independent experiments is provided in the box plot on the right. ***p<0.001, **p<0.01, *p<0.05 by Student’s t-test. (C) Representative immunofluorescence images of the anoikis assay (see the ‘Methods’ section) performed for FC1199B CTR and OE treated with vehicle (Control) or a RhoKi. Scale bars, 100 µm. Quantification of four independent experiments is provided in the box plot on the right. *p<0.05 by Student’s t-test. (D) Immunoblot analysis of phospho-FAK, and total FAK in whole cell lysates from mM cultures and KPC cell lines with different SEMA3A genotypes (eg, KO or OE). (E) Immunoblot analysis of phospho-FAK and total FAK in whole cell lysates from mM3L and FC1199B treated with recombinant SEMA3A. GAPDH was used as loading control in D and E. (F) Quantification of apoptotic cells from the anokis assay of the SEMA3A knockout mM3L treated with vehicle, with the RhoK inhibitor (RKi), the recombinant SEMA3A (S3A-FC) or the combination of S3A-FC and defactinib (FAKi). Data are displayed as mean ± SD of four technical replicates. *p<0.05, ***p<0.001 by Student’s t-test. (G) Stacked bar plot displaying the percentage of mice (n=7 per group) displaying lung metastases on tail-vein injection of Sema3a proficient (NTC) and deficient (KO) cells. Scale bar 1 mm. GAPDH, glyceraldehyde 3-phosphate dehydrogenase; Poly-HEMA, poly(2-hydroxyethyl methacrylate).
Figure 5
Figure 5
Transcriptomic changes following SEMA3A perturbation. (A) Volcano plot of the differences in gene expression between control (CTR, n=3) and Sema3a overexpression (OE n=3). Indicated are some of the genes with log2FC expression≥2 and adjusted p<0.05. See online supplemental table S1 for the full list of differentially expressed genes. (B) Enrichment of selected pathways (GSEA) when comparing FC1199B Sema3alow (CTR) and FC1199B overexpressing Sema3a (OE). See also online supplemental table S2. (C) GSEA plot evaluating the Squamous signature on Sema3a overexpression (OE) in FC1199B cells. (D) Volcano plot of the differences in gene expression between control (NTC, n=3) and Sema3a knockout (KO, n=3). Indicated are some of the genes with log2FC expression≥2 and adjusted p<0.05. See online supplemental table S3 for the full list of differentially expressed genes. (E) Enrichment of selected pathways (GSEA) when comparing Sema3a proficient (NTC) and deficient (KO) FC1199A cells. See also online supplemental table S4. (F) GSEA plots evaluating the Gene Programme 3 (GP3, TGFβ pathway) on Sema3a knockout in FC1199A cells. (G–H) Enrichment of selected pathways when comparing SEMA3A high and low tissues from the ICGC (G) and the PanCuRx (H) cohorts. See also online supplemental tables S5–S8. In B, E, G and H, GSEA was performed using gene sets from Hallmark, GO, KEGG, Reactome and HP databases in MsigDB library. Displayed gene sets that passed false discovery rate <0.05. GSEA, gene set enrichment analysis.
Figure 6
Figure 6
SEMA3A promotes growth of PDAC cells through modification of the tumour microenvironment. (A) On the left, line graph showing tumour volumes (mm3) of pancreatic masses detected on the orthotopic injection of 1×10⁵ cells from FC1199A (n=11/group). Means±SD are shown; difference not reaching statistical significance by Student’s t-test. Middle panel, histological images of transplanted tumours; scale bar as indicated. On the right, stacked bar plot displaying the percentage of tumour bearing mice in the two cohorts (NTC and KO). (B) Stacked bar plot displaying the percentage of mice (n=5 per group) displaying liver metastases on intrasplenic injection of Sema3a proficient (NTC) deficient (KO) and overexpressing (OE) FC1199 cells. Scale bar 1 mm. (C) Line graph showing tumour volumes (mm3) of pancreatic masses detected on injection of 1×10⁶ cells from mM3L organoids into the pancreata of immunocompetent (n=10 mice per group, left panel) or immunodeficient (n=5 mice per group, right panel) mice. Means±SD are shown. ****p<0.001 by two-way ANOVA with Sidak’s test for multiple comparison. Tumour volume was assessed using Vevo 2100 System with a MS250, 13–24 MHz scanhead (Visual Sonics). (D) Enrichment of selected pathways when comparing tissues from Sema3a deficient (n=3) and proficient (n=3) tumours. GSEA was performed using gene sets from Hallmark, GO, Reactome and HP databases in MsigDB library. Displayed gene sets that passed false discovery rate <0.05. See online supplemental tables S9 and S10 for details. (E–F) Representative immunohistochemical staining for T cells markers (CD3 and CD8) and the macrophage marker F4/80 in pancreatic tissues from mice transplanted with: (E) FC1199A cells or (F) mM3L organoid cultures stably transduced with either non-targeting vector (NTC) or gRNA targeting Sema3a (KO). Scale bars, 50 µm. Quantification is provided on the left as mean±SD (see the ‘Methods’ section). At least five individual areas per case and a minimum of five mice/arm were evaluated. Arrowheads indicate positive staining. ANOVA, analysis of variance.
Figure 7
Figure 7
Increased intratumoural infiltration of TAMs contributes to the aggressive behaviour of SEMA3A high tumours. (A) Bright-field images of migrated macrophages in the transwell assay (see methods, left panel). The quantification is provided on the right as bar plots displaying mean±SD of the optical density values from three technical replicates. ***p<0.001, **p<0.01, *p<0.05 by unpaired Student’s t-test. (B) Left panel, brightfield images of mouse RAW 264.7 cells treated as indicated for up to 72 hours. From left to right, untreated (M0), combination of IL4+IL13, conditioned media from control cells and conditioned media from cells overexpressing SEMA3A. Right panel, qPCR showing relative mRNA expression of Nos2 and Arg1. Data are mean of three technical replicates. ****p<0.0001 by Student’s t-test. (C) qPCR showing relative mRNA expression of Nos2 (left) and Arg1 (right). Data are mean of three technical replicates. ***p<0.001, **p<0.01, *p<0.05 by unpaired Student’s t-test. (D) Representative immunohistochemical staining for the macrophage marker F4/80 in pancreatic tissues from mice transplanted with FC1199B cells stably transduced with either mock (CTR) or a vector carrying Sema3a ORF (3 A-OE) treated with control IgG or CSF1R monoclonal antibody. (E) Representative immunohistochemical staining for the cytotoxic T cell marker (CD8) in pancreatic tissues from mice transplanted with FC1199B cells stably transduced with either mock (CTR) or a vector carrying Sema3a ORF (3 A-OE) treated with control IgG or CSF1R monoclonal antibody. In E and F, scale bars, 50 µm. Quantification is provided on the left as mean±SD (see the ‘Methods’ section). At least five individual areas per case and a minimum of five mice/arm were evaluated. Arrowheads indicate positive staining. (F) Line graph showing tumour volumes (mm3) of pancreatic masses detected in mice transplanted with SEMA3A overexpressing (SEMA3Ahigh) or null (SEMA3Anull) cells treated with αCD8 (CD8, n=10). (G) Kaplan-Meier survival analysis of mice transplanted with SEMA3A high cells and treated with control IgG (Ctrl, n=10), Gemcitabine (Gem, n=10), αCSF1R (CSF1Ri, n=10) or combination of Gemcitabine and αCSF1R (GC, n=10). Statistical differences identified by log-rank test.

References

    1. Rahib L, Wehner MR, Matrisian LM, et al. . Estimated projection of US cancer incidence and death to 2040. JAMA Netw Open 2021;4:e214708. 10.1001/jamanetworkopen.2021.4708 - DOI - PMC - PubMed
    1. Casolino R, Braconi C, Malleo G, et al. . Reshaping preoperative treatment of pancreatic cancer in the era of precision medicine. Ann Oncol 2021;32:183–96. 10.1016/j.annonc.2020.11.013 - DOI - PMC - PubMed
    1. Barreto SG, Pandanaboyana S, Ironside N, et al. . Does revision of resection margins based on frozen section improve overall survival following pancreatoduodenectomy for pancreatic ductal adenocarcinoma? A meta-analysis. HPB (Oxford) 2017;19:573–9. 10.1016/j.hpb.2017.03.006 - DOI - PubMed
    1. Tanaka M, Mihaljevic AL, Probst P, et al. . Meta-analysis of recurrence pattern after resection for pancreatic cancer. Br J Surg 2019;106:1590–601. 10.1002/bjs.11295 - DOI - PubMed
    1. Tummers WS, Groen JV, Sibinga Mulder BG, et al. . Impact of resection margin status on recurrence and survival in pancreatic cancer surgery. Br J Surg 2019;106:1055–65. 10.1002/bjs.11115 - DOI - PMC - PubMed

Publication types

LinkOut - more resources