. 2024 Apr 26;15(1):3552.
doi: 10.1038/s41467-024-47799-z.

CAR affinity modulates the sensitivity of CAR-T cells to PD-1/PD-L1-mediated inhibition

Affiliations

CAR affinity modulates the sensitivity of CAR-T cells to PD-1/PD-L1-mediated inhibition

Irene Andreu-Saumell et al. Nat Commun. .

Abstract

Chimeric antigen receptor (CAR)-T cell therapy for solid tumors faces significant hurdles, including T-cell inhibition mediated by the PD-1/PD-L1 axis. The effects of disrupting this pathway on T-cells are being actively explored and controversial outcomes have been reported. Here, we hypothesize that CAR-antigen affinity may be a key factor modulating T-cell susceptibility towards the PD-1/PD-L1 axis. We systematically interrogate CAR-T cells targeting HER2 with either low (LA) or high affinity (HA) in various preclinical models. Our results reveal an increased sensitivity of LA CAR-T cells to PD-L1-mediated inhibition when compared to their HA counterparts by using in vitro models of tumor cell lines and supported lipid bilayers modified to display varying PD-L1 densities. CRISPR/Cas9-mediated knockout (KO) of PD-1 enhances LA CAR-T cell cytokine secretion and polyfunctionality in vitro and antitumor effect in vivo and results in the downregulation of gene signatures related to T-cell exhaustion. By contrast, HA CAR-T cell features remain unaffected following PD-1 KO. This behavior holds true for CD28 and ICOS but not 4-1BB co-stimulated CAR-T cells, which are less sensitive to PD-L1 inhibition albeit targeting the antigen with LA. Our findings may inform CAR-T therapies involving disruption of PD-1/PD-L1 pathway tailored in particular for effective treatment of solid tumors.


Conflict of interest statement

S.G. is an inventor on patents related to CAR-T cell therapy, filed by the University of Pennsylvania and licensed to Novartis and Tmunity, and has received commercial research funding from Gilead. A.R-G. is an inventor on patents related to CAR-T cell therapy, filed by the University of Pennsylvania. The remaining authors declare no competing interests.

Figures
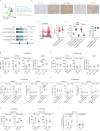
Fig. 1
Fig. 1. PD-1 KO restores LA HER2-28Z CAR-T cell function in vitro but does not affect HA HER2-28Z CAR-Ts.
a Expression and quantification of PD-L1 molecules in SKOV3 cells expressing variable PD-L1 densities and compared to wild type (WT) cells alone or co-cultured with CAR-T cells for 48 h as assessed by flow cytometry. b Immunohistochemical staining of PD-L1 in SKOV3 PD-L1 KO, Low, High, and WT tumors treated with control T-cells or CAR-T cells at day 20–70 post-implantation in mice. Representative images from n = 2 tumors per group are shown. Scale bar, 200 µm. c Schematic overview of CAR constructs used with their corresponding affinity values. HER2-28Z CAR-T cells with LA or HA and with or without PD-1 genome editing were generated from 9 to 13 healthy donors. CAR (d) and PD-1 (e) expression were quantified by flow cytometry and the efficiency of PD-1 knock-out (f) was quantified by using ICE tool (Synthego). LA (g, i) or HA (h, j) HER2-28Z CAR-T cells were co-cultured with indicated SKOV3 cells for 24 h. The PD-1/PD-L1 axis was inhibited by knocking out PD-1 (g, h) or by addition of blocking antibodies (i, j). IFN-γ production was analyzed by ELISA (n = 3–5). Data is represented as absolute levels (left panel) or as fold change versus mock (right panel). k LA (left panel) or HA (right panel) FRβ−28Z CAR-T cells were co-cultured with SKOV3 expressing FRβ and indicated PD-L1 densities. IFN-γ production was quantified by ELISA (n = 4). l T-cell proliferation of LA (left panel) or HA (right panel) HER2-28Z CAR-T cells following co-culture with HCC1954. Fold change of absolute T-cell numbers at day 6 versus day 0 is represented (n = 4). Data in (dl) are pooled from independent experiments where each dot represents CAR-T cells generated from a different donor (n) and represented as mean ± SD (in df) or mean ± SEM (in gl). p values by a two-tailed paired T test (e, g, h for absolute levels graphs, k, l), one-way ANOVA (g, h for fold change graphs) or two-tailed one sample T test (i) are indicated. Source data and exact n values for each group in (dj) are provided as a Source Data file.
Fig. 2
Fig. 2. PD-1 KO restores LA HER2-28Z CAR-T cell function in vivo but does not affect HA HER2-28Z CAR T-cells.
a Tumor measurements of NSG mice bearing SKOV3 tumors expressing indicated PD-L1 densities and treated with 3–4 × 106 control T-cells, mock or PD-1 KO LA HER2-28Z CAR+-T cells (n = 8 for SKOV3 PD-L1 KO and PD-L1 High; n = 8, 13 or 12 for control, mock and PD-1 KO groups, respectively, for SKOV3 PD-L1 Low). b, c NSG mice bearing SKOV3 PD-L1 High tumors were treated with 3 × 106 control T-cells (n = 5), mock (n = 7), mock + anti PD-L1 antibody (n = 7) or PD-1 KO (n = 8) LA HER2-28Z CAR+-T cells. b Tumor measurements and (c) percentage of tumor growth indicated as the change in tumor volume on day 20 versus baseline is shown. d Tumor measurements of NSG mice bearing SKOV3 tumors expressing indicated PD-L1 densities and treated with 3–4 × 106 control T-cells, mock or PD-1 KO HA HER2-28Z CAR+-T cells (n = 8, 13 and 12 for control, mock and PD-1 KO groups, respectively, for SKOV3 PD-L1 KO; n = 8 for SKOV3 PD-L1 High). Tumor measurements of NSG mice bearing SKOV3 wild type tumors treated with 3 × 106 control T-cells, mock or PD-1 KO HER2−28Z CAR+-T cells of (e) LA (n = 8 for control and n = 10 for mock and PD-1 KO groups) or (f) HA (n = 8 for all groups). g Tumor measurements of NSG mice bearing HCC1954 tumors treated with 3 × 106 control T-cells (n = 9), mock (n = 10) or PD-1-KO (n = 10) LA HER2-28Z CAR+-T cells. Data in (a, b) and (dg) are represented as mean tumor volume ±SEM and n indicates tumors per group. p values by (c) one-way ANOVA with Tukey post-hoc test or (a, b, dg) two-way ANOVA with Tukey’s multiple testing correction are indicated. Source data are provided as a Source Data file.
Fig. 3
Fig. 3. HA HER2-28Z CAR-T cells are more resistant to inhibition by increasing amounts of PD-L1 in a protein-functionalized planar glass SLB system.
a Schematic representation of an SLB featuring fluorescently labeled proteins (HER2 and PD-L1) and ICAM-1. Created with Biorender.com. b IFN-γ production by HER2-28Z mock and PD-1-KO LA (left panel) or HA (right panel) CAR-T cells after 24 h of co-culture with SLBs containing increasing concentrations of PD-L1. HER2-28Z mock and PD-1-KO (c) LA or (d) HA CAR-T cells were co-cultured for 24 h with SLBs containing either HER2 alone (2 ng) or HER2 along with PD-L1 (200 ng). IFN-γ secretion as measured by ELISA is represented as absolute levels (left panel) or fold change of the HER2 + PD-L1 condition compared to HER2 alone (right panel). Data in (b) is representative of two different donors and in (c, d) is shown as mean of two different donors (n = 2). Source data are provided as a Source Data file.
Fig. 4
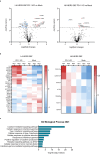
Fig. 4. Differential transcriptomic response of HA and LA HER2-28Z CAR-T cells to PD-1 KO.
Transcriptomic analysis of mock and PD-1 KO LA or HA HER2-28Z CAR-T cells was performed after stimulation with SKOV3 WT tumor cells for 48 h. a Volcano plots of differential expression between mock and PD-1 KO in LA (left panel) or HA (right panel) HER2-28Z CAR-T cells. Red dots represent genes upregulated in PD-1 KO vs mock, blue dots represent genes downregulated genes in PD-1 KO vs mock and black dots represent genes not differentially expressed. Differentially expressed genes are annotated. The horizontal line is at an adjusted p value of 0.05. b Heat map of differential expression between mock and PD-1 KO in LA (left panel) or HA (right panel) HER2−28Z CAR-T cells. c Gene Ontology (GO) Biological process of differentially expressed genes between PD-1 KO and mock LA HER2-28Z CAR-T cells. Data in (ac) is represented as mean of n = 3 donors. In (a, b) p value thresholds (p < 0.05) were derived from Rosalind and adjusted using the Benjamini–Hochberg method. In (c) p value thresholds (p < 0.05) were derived from Enrichr by a Fisher exact test and adjusted using the Benjamini–Hochberg method. All tests were two-sided. Source data are provided as a Source Data file.
Fig. 5
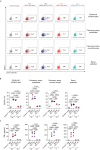
Fig. 5. Polyfunctional profiling of PD-1 KO LA and HA HER2-28Z CAR-T cells.
Single-Cell Adaptive Immune panel (Isoplexis) of mock and PD-1 KO LA and HA HER2-28Z CAR-T cells after co-culture with SKOV3 tumor cells for 24 h (E:T = 1:3). Three-dimensional t-SNE plots of (a) LA and (b) HA mock (blue) and PD-1 KO (orange) HER2-28Z CAR-T cells by differentiating them based on their cytokine functional differences. Frequencies of polyfunctional cells of mock and PD-1 KO (c) LA and (d) HA HER2-28Z CAR-T cells. Polyfunctionality Strength Index (PSI) of mock and PD-1 KO (e) LA and (f) HA HER2-28Z CAR-T cells. Fold-change values for PD-1 KO versus mock are indicated. g Representative flow cytometry plots of intracellular cytokine staining for TNF-α and IFN-γ in mock and PD-1 KO LA and HA HER2−28Z CAR-T cells after co-culture with SKOV3 tumor cells for 24 hours (E:T = 1:3) (gated on live/CD45+). h Frequencies of IFN-γ+TNF-α+ T-cells represented as absolute numbers and fold change of PD-1 KO versus mock are shown. In (af), data is shown as mean from n = 2 donors. In (h), data is pooled from four independent experiments where each dot represents CAR-T cells generated from a different donor (n = 5), and is represented as mean ± SEM. p values by a two-tailed paired T test for absolute numbers or by two-tailed one-sample T test for fold-change graphs are indicated. Source data are provided as a Source Data file.
Fig. 6
Fig. 6. HA HER2-28Z CAR-T cells demonstrate reactivity against a panel of primary healthy cells while LA CAR-T cells do not.
Mock or PD-1 KO HER2-28Z CAR-T cells of LA or HA were co-cultured with a panel of human primary cells. a, b CD107-α degranulation marker was measured after 6 h of co-culture (E:T = 1:1). a Representative flow cytometry plots and (b) percentage of cells producing CD107-α (gated on live/CD45+) are shown. c IFN-γ production by HER2-28Z CAR-T cells after 24 h of co-culture (E:T = 3:1) as quantified by ELISA. Data in (b, c) are plotted as mean ± SEM (n = 3 donors). p values by one-way ANOVA with Tukey’s multiple testing correction are indicated. Source data are provided as a Source Data file.
Fig. 7
Fig. 7. Role of target antigen and CAR expression in determining sensitivity to PD-L1.
IFN-γ production by mock or PD-1-KO (a) LA or (b) HA HER2-28Z CAR-T cells after 72 h of co-culture with SLBs containing either HER2 alone (50 ng) or increasing concentrations of HER2 along with PD-L1 (200 ng) as measured by ELISA. Data from one donor is represented as absolute levels (left panel) or fold change of IFN-γ by PD-1 KO versus mock HER2-28Z CAR-T cells (right panel). IFN-γ production by mock or PD-1-KO LA (left panel) or HA (right panel) HER2-28Z CAR-T cells after 24 h of co-culture with (c) MDA-MB-468 PD-L1 high HER2 high or (d) MDA-MB-468 PD-L1 high HER2 low (E:T = 3:1) as measured by ELISA. e Representative flow cytometry plots and frequencies of IFN-γ+TNF-α+ T-cells (gated on live/CD45+) of intracellular cytokine staining for TNF-α and IFN-γ in mock and PD-1 KO LA and HA HER2-28Z CAR-T cells after co-culture with MDA-MB-468 PD-L1 high HER2 high (f) or MDA-MB-468 PD-L1 high HER2 low (g) tumor cells for 24 h (E:T = 1:3). h Schematic representation of criteria to discriminate between Low CAR and High CAR-T cell products. Created with Adobe Illustrator. IFN-γ production by mock or PD-1-KO (i) LA or (j) HA HER2-28Z CAR-T cells with either Low (n = 7 donors for LA and n = 4 for HA) or High (n = 3 donors) CAR frequencies after 24 h of co-culture with SKOV3 PD-L1 High tumor cells (E:T = 3:1). Data in (c, d, f, g) is represented as mean ± SEM (n = 3 donors) and p values by a two-tailed paired T-test are indicated. Data in (i) and (j) is pooled from nine and five independent experiments, respectively, where each dot represents CAR-T cells generated from different donors (n) and represented as mean ± SEM for absolute levels (left panel) and fold change of PD-1 KO versus mock (right panel). p values by a two-tailed paired T test (for absolute levels) or a two-tailed one-sample T-test (for fold change) are indicated. Source data are provided as a Source Data file.
Fig. 8
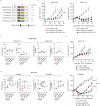
Fig. 8. Influence of scFv and co-stimulatory domains in PD-1/PD-L1-mediated inhibition of CAR-T cells.
a Schematic overview of CAR constructs used with their corresponding affinity values. b Tumor measurements of NSG mice bearing SKOV3 tumors treated with 5 × 106 control T-cells, mock or PD-1 KO LA HER2-ICOSZ CAR+-T cells (n = 10, left panel) or with 3 × 106 control T-cells, mock or PD-1 KO HA HER2-ICOSZ CAR+-T cells (n = 7 for control and n = 8 for mock and PD-1 KO, right panel). c Quantification of IFN-γ and IL-2 production by PD-1 KO or mock LA HER2-BBZ CAR-T cells, alone or in combination with anti PD-1 or anti PD-L1 antibodies, after 24 h of co-culture with SKOV3 tumor cells (E:T = 3:1) as measured by ELISA (n = 3 for all groups except for mock+anti PD-L1 with n = 1). d Tumor measurements of NSG mice bearing SKOV3 tumors treated with 3 × 106 control-T cells (n = 8), mock (n = 8) or PD-1 KO (n = 10) LA HER2-BBZ CAR+-T cells. e Quantification of IFN-γ and IL-2 production by PD-1 KO or mock Meso−28Z CAR-T cells, alone or in combination with anti PD-1 or anti PD-L1 antibodies, after 24 h of co-culture with CAPAN2 tumor cells (E:T = 3:1) as measured by ELISA (n = 3). f Tumor measurements of NSG mice bearing CAPAN2 tumors and treated with 2 × 106 control T cells, mock or PD-1 KO Meso-28Z CAR+-T cells (n = 12). Data in (b, d, f) are represented as mean tumor volume ± SEM and n indicates tumors per group. Data in (c, e) are represented as mean ± SEM of absolute levels (left panel) or fold change of indicated groups as compared to mock CAR-T cells (right panel). Data is pooled from independent experiments where each dot indicates a different donor for CAR-T generation (n). p values by two-way ANOVA with Sidak multiple testing correction (b), two-way ANOVA with Tukey’s multiple testing correction (f), one-way ANOVA with Tukey post hoc test (e, absolute levels) or one-sample T-test (e, fold change) are indicated. Source data are provided as a Source Data file.

References

    1. June CH, Sadelain M. Chimeric antigen receptor therapy. N. Engl. J. Med. 2018;379:64–73. doi: 10.1056/NEJMra1706169. - DOI - PMC - PubMed
    1. Del Bufalo F, et al. GD2-CART01 for relapsed or refractory high-risk neuroblastoma. N. Engl. J. Med. 2023;388:1284–1295. doi: 10.1056/NEJMoa2210859. - DOI - PubMed
    1. Majzner RG, et al. GD2-CAR T cell therapy for H3K27M-mutated diffuse midline gliomas. Nature. 2022;603:934–941. doi: 10.1038/s41586-022-04489-4. - DOI - PMC - PubMed
    1. Qi C, et al. Claudin18.2-specific CAR T cells in gastrointestinal cancers: phase 1 trial interim results. Nat. Med. 2022;28:1189–1198. doi: 10.1038/s41591-022-01800-8. - DOI - PMC - PubMed
    1. Rodriguez-Garcia A, et al. CAR-T cells hit the tumor microenvironment: strategies to overcome tumor escape. Front. Immunol. 2020;11:1109. doi: 10.3389/fimmu.2020.01109. - DOI - PMC - PubMed

Publication types

MeSH terms