. 2024 Apr 26;15(1):3567.
doi: 10.1038/s41467-024-47933-x.

Single-cell analyses reveal transient retinal progenitor cells in the ciliary margin of developing human retina

Affiliations

Single-cell analyses reveal transient retinal progenitor cells in the ciliary margin of developing human retina

Birthe Dorgau et al. Nat Commun. .

Abstract

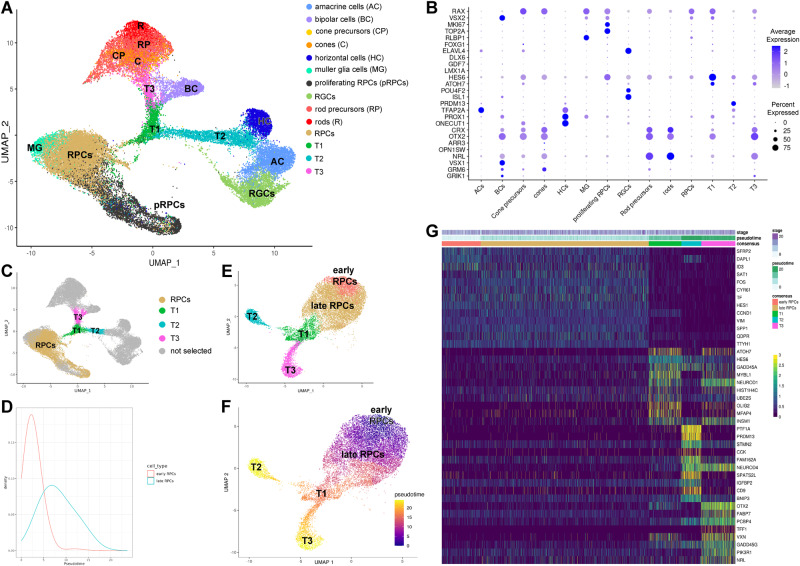
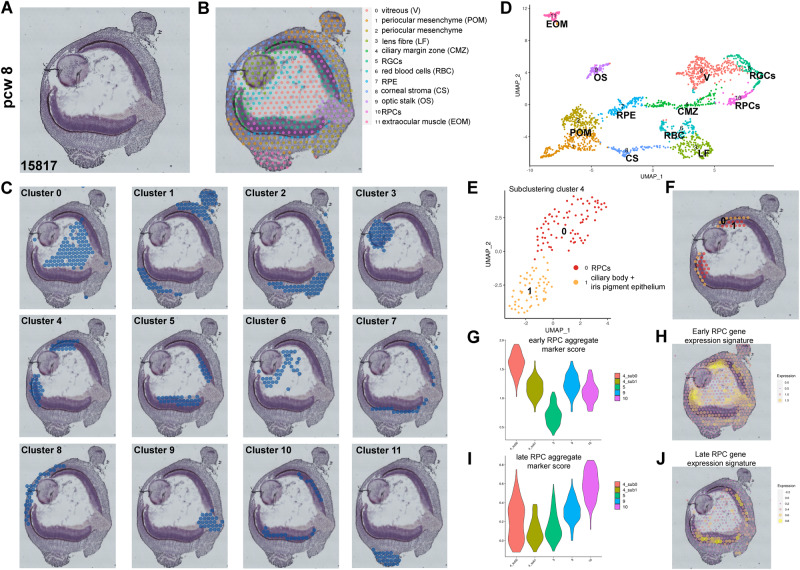
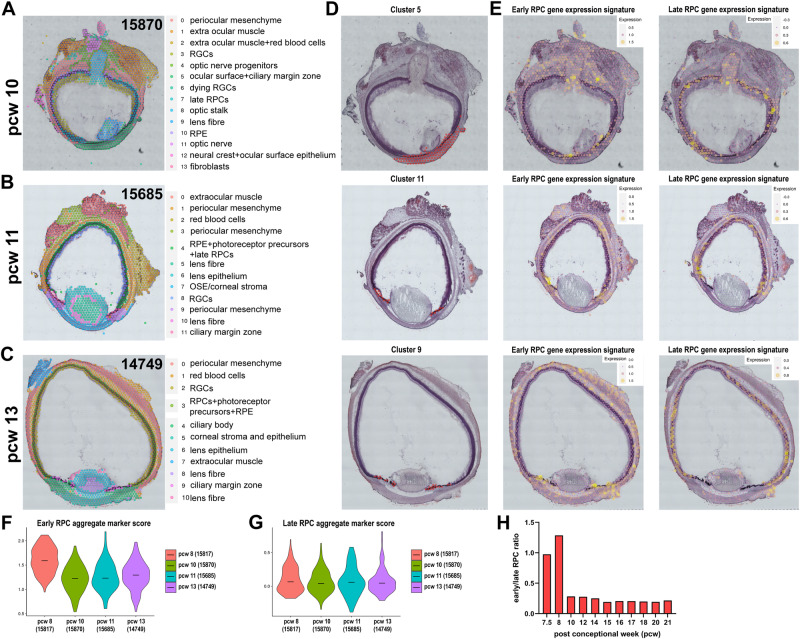
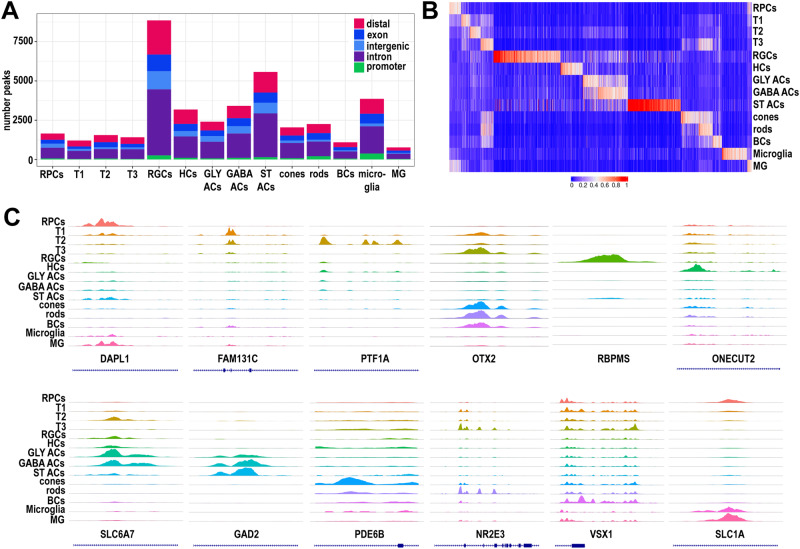
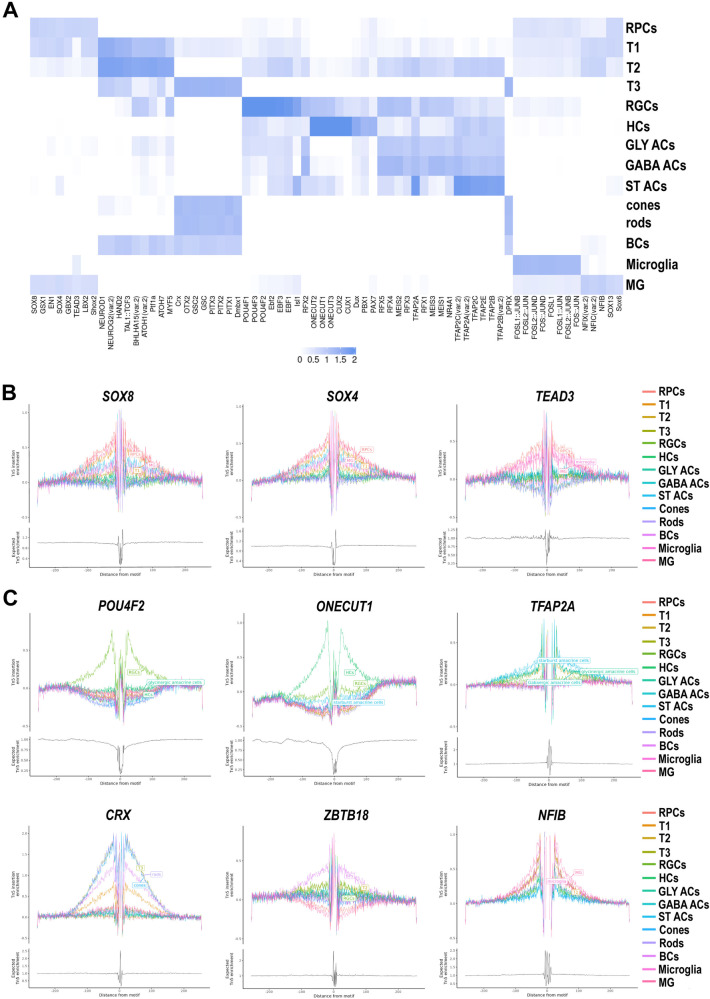
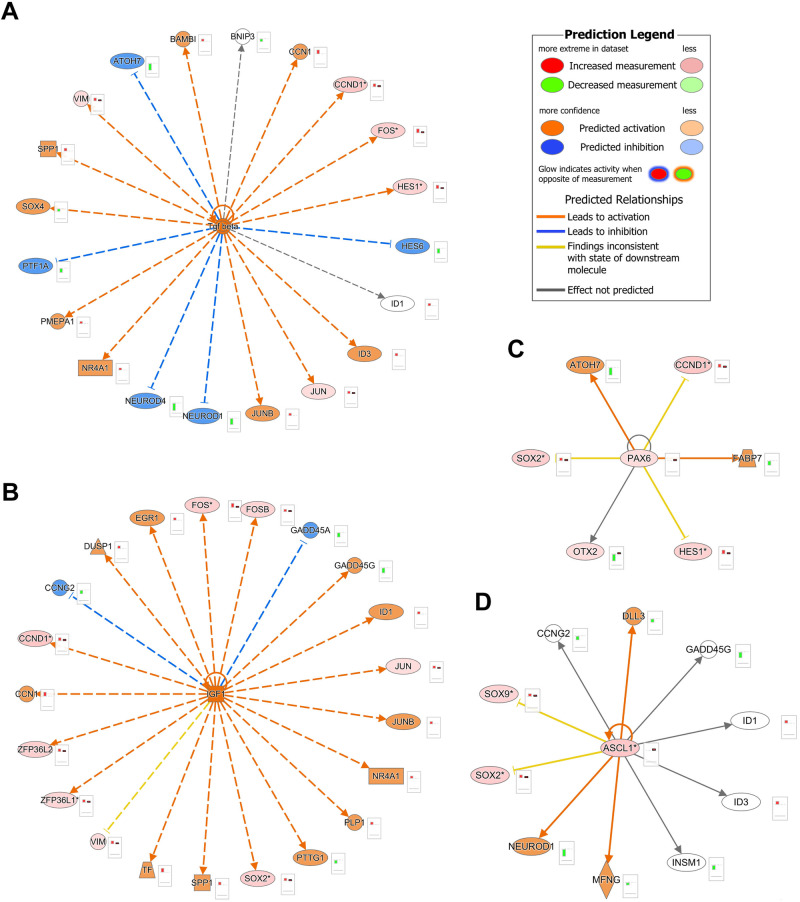
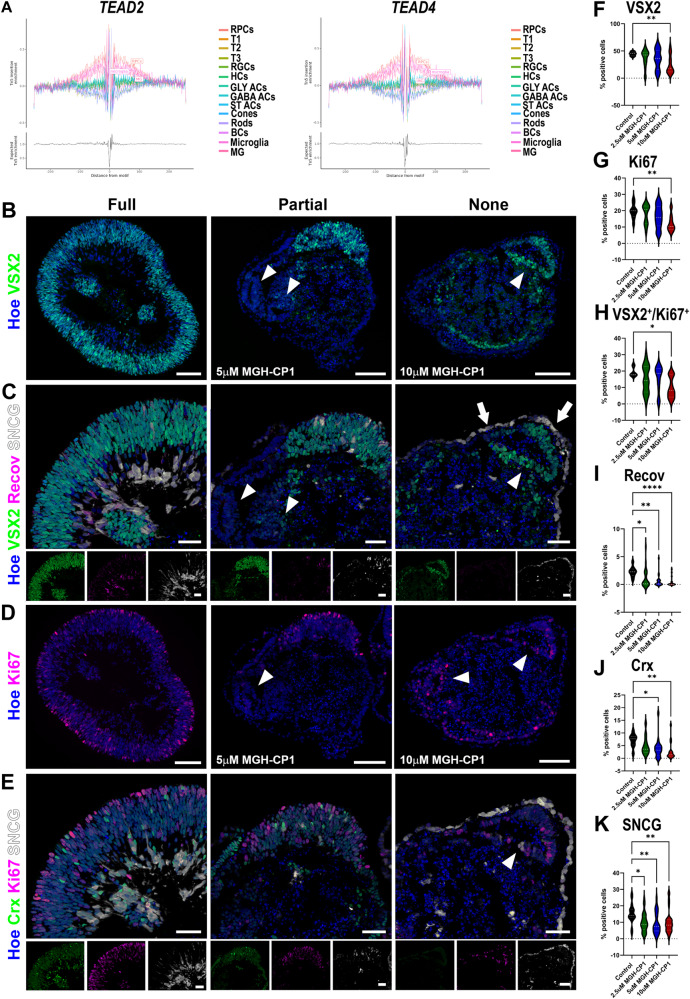
The emergence of retinal progenitor cells and differentiation to various retinal cell types represent fundamental processes during retinal development. Herein, we provide a comprehensive single cell characterisation of transcriptional and chromatin accessibility changes that underline retinal progenitor cell specification and differentiation over the course of human retinal development up to midgestation. Our lineage trajectory data demonstrate the presence of early retinal progenitors, which transit to late, and further to transient neurogenic progenitors, that give rise to all the retinal neurons. Combining single cell RNA-Seq with spatial transcriptomics of early eye samples, we demonstrate the transient presence of early retinal progenitors in the ciliary margin zone with decreasing occurrence from 8 post-conception week of human development. In retinal progenitor cells, we identified a significant enrichment for transcriptional enhanced associate domain transcription factor binding motifs, which when inhibited led to loss of cycling progenitors and retinal identity in pluripotent stem cell derived organoids.


Conflict of interest statement

The authors declare no competing interests.

Figures

Fig. 1
Fig. 1. RPCs identification and their developmental trajectories during human retinal development.
A UMAP plot of integrated scRNA-Seq foetal retina cells. Each cluster was identified based on expression of retinal specific cell markers. Highly expressed markers for each clusters are shown in Supplementary Data 2. B Dotplot showing highly expressed marker genes for each retinal cell type identified in the integrated scRNA-Seq data. C RPCs and transient neurogenic progenitors named T1, T2 and T3 were identified. Highly expressed markers for each cluster along the pseudotime trajectory are shown in Supplementary Data 2. D Density plot of RPC pseudotime scores showing a bimodal distribution corresponding to the early and late RPCs. E, F Pseudotime analysis demonstrating transition from early to late RPCs, and to T1 progenitors, which further commit to either T2 or T3 transient neurogenic progenitors. G Gene expression heatmap showing similarities in gene expression patterns between early and late RPCs, but distinct gene expression signatures in T1, T2 and T3 neurogenic progenitors.
Fig. 2
Fig. 2. ST analysis of 8 PCW human eye sections reveals the location of early RPCs in the CMZ.
A Representative histological staining of the 8 PCW fresh frozen human eye section. Four sections from the same eye sample were processed for ST analyses. B, C Spatial localisation of the 12 clusters identified from the ST analysis. Highly expressed markers for each cluster are shown in Supplementary Data 3. D UMAP of spatial transcriptomics scRNA-Seq data. E Subclustering of ciliary margin zone (cluster 4) reveals the presence of two subclusters namely RPCs and ciliary body, and iris pigmented epithelial cells: their spatial localisation is shown in panel (F). G and (I) Expression violin plots showing the highest aggregate expression scores for early RPCs in the peripheral retina (CMZ) and late RPCs in the central retina respectively, compared to all other retinal clusters identified in the ST analysis. H and (J) Early and late RPC gene expression signatures superimposed on the spatial image of 8 PCW human eye.
Fig. 3
Fig. 3. ST analyses demonstrate decreased presence of early RPCs in the ciliary margin zone as development proceeds from 10 to 13 PCW.
AC Spatial localisation of all cell clusters identified from the ST analyses. Four sections from each eye sample were processed for ST analyses. D The CMZ clusters are shown for each developmental stage. E Early and late RPC gene expression signatures superimposed to the spatial images of each eye specimen. F, G Violin plots showing early (F) and late (G) RPCs aggregate expression scores across four developmental stages, demonstrating the reduction of early RPCs during development. H Early RPCs reach a peak at 7.5-8 PCW and then decline from 10 PCW onwards in the human developing retina. The ratio of early to late RPCs is inferred from the scRNA-Seq data.
Fig. 4
Fig. 4. Single cell ATAC-Seq analysis of developing retina samples reveals cell type specific chromatin accessibility profiles.
A The number and type of chromatin accessibility profiles for each cell type. B Heatmap showing differentially accessible of chromatin accessibility peaks (columns) for each cell type (rows). C Representative examples of chromatin accessibility peaks for retinal cell specific marker genes. Each track represents the aggregate scATAC signal of all cells from the given cell type normalized by the total number of reads in TSS regions.
Fig. 5
Fig. 5. Motif analysis of accessible DNA peaks predicts cell type specific TFs in the developing human retina.
A Heatmap of transcription factor binding motifs enriched in each cell type. More significant enrichment is indicated by the darker colours. B Footprinting analysis of selected TFs predicted to show a significant enrichment in RPCs. C Footprinting analysis of selected TFs predicted to show a significant enrichment in transient neurogenic progenitors and retinal neurons. Additional abbreviations to those mentioned in the main text: Gly ACs glycinergic amacrine cells, GABA ACs gabaergic amacrine cells, ST ACs starburst amacrine cells, HCs horizontal cells, MG Muller glia cells.
Fig. 6
Fig. 6. Gene regulatory networks in RPCs.
Representative gene regulatory networks in RPCs depicting activated upstream regulators (A, B) and inhibited upstream regulators (C, D) and their target genes. Upstream regulatory networks were generated with IPA using differentially expressed genes from the scRNA-Seq data and differential accessibility analysis in the scATAC-Seq data. The networks show predictions of upstream regulators which might be activated or inhibited to explain observed upregulation/downregulations in the data. The barplots next to each molecule represent the relative expression in the sRNA-Seq (column 1) and scATAC-Seq datasets (column 2). The colours for the network nodes/barplots indicate observed upregulation/ increased chromatin accessibility (red), predicted upregulation/increased chromatin accessibility (orange), observed downregulation (green) and predicted downregulation/ decreased chromatin accessibility (blue). The colour of the edges represents the relationships between the molecules; orange = prediction and observation are consistent with activation; blue = prediction and observation are consistent with downregulation; yellow = prediction and observation are inconsistent; and grey relationship between the molecules is available in the IPA knowledge database. *- indicates duplicates in scATAC-Seq dataset.
Fig. 7
Fig. 7. TEAD binding plays a significant role in RPC proliferation.
A Footprinting analysis of TEAD2 and TEAD4 showing a significant enrichment in RPCs. Additional abbreviations to those mentioned in the main text: Gly ACs- glycinergic amacrine cells, GABA ACs – gabaergic amacrine cells, ST ACs – starburst amacrine cells, HCs – horizontal cells, MG- Muller glia cells. BK Quantitative immunofluorescence analyses for the presence of VSX2+ RPCs (B, F), Ki67+ proliferating cells (D, E, G), VSX2+Ki67+ (H), SCNG+ RGCs (C, E, K), and Recoverin+ (C, I) and CRX+ photoreceptor precursors (E, J) reveal loss of RPCs, disturbed retinal lamination, and attenuation of photoreceptor and RGCs specification. Bottom panel insets at (C) and (E) panels show individual antibody and nuclear staining. White arrowheads show the presence of rosettes comprised of RPCs or Ki67+ proliferating cells. Scale bars 100 µM for (BD) and 50 µM for (CE) and bottom inset panels. FK Data presented as median and quartiles. 9 – 39 retinal organoids per condition were used as documented in the Source data file. One-way ANOVA (FH) or Kruskal-Wallis (IK) with Dunnett’s multiple comparisons test (*p < 0.05; **p < 0.01, ***p < 0.001). Source data are provided as a Source Data file.

References

    1. Marquardt T, Gruss P. Generating neuronal diversity in the retina: one for nearly all. Trends Neurosci. 2002;25:32–38. doi: 10.1016/S0166-2236(00)02028-2. - DOI - PubMed
    1. Mellough CB, et al. An integrated transcriptional analysis of the developing human retina. Development. 2019;146:dev169474. doi: 10.1242/dev.169474. - DOI - PMC - PubMed
    1. Aldiri I, et al. The dynamic epigenetic landscape of the retina during development, reprogramming, and pumorigenesis. Neuron. 2017;94:550–568.e510. doi: 10.1016/j.neuron.2017.04.022. - DOI - PMC - PubMed
    1. Hoshino A, et al. Molecular anatomy of the developing human retina. Dev. Cell. 2017;43:763–779.e764. doi: 10.1016/j.devcel.2017.10.029. - DOI - PMC - PubMed
    1. Lu Y, et al. Single-cell analysis of human retina identifies evolutionarily conserved and species-specific mechanisms controlling development. Dev. Cell. 2020;53:473–491.e479. doi: 10.1016/j.devcel.2020.04.009. - DOI - PMC - PubMed

Publication types