. 2024 Apr 26;15(1):3301.
doi: 10.1038/s41467-024-47670-1.

Diphthamide deficiency promotes association of eEF2 with p53 to induce p21 expression and neural crest defects

Affiliations

Diphthamide deficiency promotes association of eEF2 with p53 to induce p21 expression and neural crest defects

Yu Shi et al. Nat Commun. .

Abstract

Diphthamide is a modified histidine residue unique for eukaryotic translation elongation factor 2 (eEF2), a key ribosomal protein. Loss of this evolutionarily conserved modification causes developmental defects through unknown mechanisms. In a patient with compound heterozygous mutations in Diphthamide Biosynthesis 1 (DPH1) and impaired eEF2 diphthamide modification, we observe multiple defects in neural crest (NC)-derived tissues. Knockin mice harboring the patient's mutations and Xenopus embryos with Dph1 depleted also display NC defects, which can be attributed to reduced proliferation in the neuroepithelium. DPH1 depletion facilitates dissociation of eEF2 from ribosomes and association with p53 to promote transcription of the cell cycle inhibitor p21, resulting in inhibited proliferation. Knockout of one p21 allele rescues the NC phenotypes in the knockin mice carrying the patient's mutations. These findings uncover an unexpected role for eEF2 as a transcriptional coactivator for p53 to induce p21 expression and NC defects, which is regulated by diphthamide modification.


Conflict of interest statement

The authors declare no competing interests.

Figures

Fig. 1
Fig. 1. Compound heterozygous Dph1 mutations from a DEDSSH patient cause reduced eEF2 diphthamide modification.
T1(a) and T2 (b) weighted images of brain magnetic resonance imaging showing hypomyelination of bilateral frontal lobes and clear septum cyst. c, d Validation of DPH1 mutations in the proband and her immediate family members by Sanger sequencing. Encoded amino acid sequences are shown at the bottom. e Pedigree diagram showing the mutations in DPH1 within the proband’s family (black arrow indicates the proband). Western blotting detected total eEF2 (f), diphthamide-modified eEF2 (g), and total DPH1 (h) in lymphoblastoid cell lysates from the sister (s), proband (p), father (f) and mother (m). Representative blots are shown at the top, and quantification of four independent experiments is summarized in the lower graphs. Values in (f, g, and h) represent means ± SEM, and statistical significance was determined by unpaired t tests with two-sided analysis. i Sequence alignment showing the conservation of Glu242 (highlighted) and the surrounding residues in eukaryotic DPH1 proteins. j AlphaFold model of the active site of human DPH1 (cyan) in complex with archaeal EF2 (brown) based on PDB 6Q2D. Note the positions of Glu242 and Arg349. Distances between residues are in Å. k Sequence alignment showing the conservation of Arg349 (highlighted) and the surrounding residues in eukaryotic DPH1 and archaeal DPH2.
Fig. 2
Fig. 2. Dph1 depletion in X. tropicalis embryos inhibits proliferation in the neuroepithelium and reduces pre-migratory NC by affecting eEF2 diphthamide modification.
a Design of gRNAs targeting X. tropicalis dph1. Black rectangles denote exons, red bars indicate gRNA target regions, and red asterisk highlights the translation start site. Wild-type (b) or snai2-eGFP transgenic (d) embryos were injected in one blastomere at 2-cell stage with the indicated Cas9 protein and gRNA, cultured to stage ~17, and processed for IHC for DPH1 (b) or directly imaged for eGFP (d). Dextran 555 dye (red) was co-injected as a lineage tracer to identify the injected side. c Wild-type embryos were injected at one-cell stage with the indicated Cas9 protein and gRNA, and cultured to stage ~17. Western blotting for DPH1 was carried out for whole-embryo lysates. e Wild-type embryos were injected in one blastomere at 2-cell stage with DPH1 MO, cultured to stage ~12.5, and processed for ISH for the indicated mRNA. ß-galactosidase mRNA was co-injected as a lineage tracer, and red-gal staining (red) was performed to identify the injected side. f, g Wild-type embryos were injected in one blastomere at 2-cell stage with the indicated Cas9 protein, gRNA and eef2 variants, cultured to stage ~15, and processed for IHC for phosphorylated histone H3 (pH3). The injected side is denoted by co-injected Dextran 555 dye (red). The denominator and numerator represent the total number of embryos scored and the number of embryos with phenotypes similar to the image, respectively. All experiments were independently repeated three times. Scale bar, 100 µm.
Fig. 3
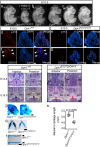
Fig. 3. KI mouse embryos carrying the proband’s Dph1 mutations have growth retardation and craniofacial defects.
acThe Dph1E237Q/Q41X compound heterozygous embryos have reduced body size, as compared with wild-type littermates and littermates harboring only one mutated allele, at E10.5 (numbers of biologically independent mice examined over 21 experiments: Dph1E237Q/Q41X, n = 28; Dph1E237Q/+, n = 46; Dph1Q41X /+n = 44; Dph1+/+, n = 45). Scale bar, 250 μm. IHC for pH3 (d, e) and SOX10 (f, g) in wild-type (d, f) and Dph1E237Q/Q41X (e, g) embryos at E10.5 (numbers of biologically independent samples: Dph1E237Q/Q41X, n = 3; Dph1+/+, n = 3). Scale bar, 100 µm. h–o Palatal defects in Dph1E237Q/Q41X embryos, as shown by H&E-stained sections of anterior and posterior portions of palatal shelves from embryo heads (numbers of biologically independent samples: Dph1E237Q/Q41X, n = 4, Dph1+/+, n = 3). The Dph1E237Q/Q41X embryos have downward extension of the palatal shelves (ps) relative to the tongue (t) at E14.5 (j, k), and unfused palatal shelves at E15.5 (red arrowheads in n, o). Scale bar, 100 µm. Mandible hypoplasia in Dph1E237Q/Q41X embryos, as indicated by Alcian blue (cartilage) and Alizarin red (bone) double staining. p Side view of the craniofacial cartilage and bones. Scale bar, 1000 µm. Dissected Meckel’s cartilage shown on both sides (q) and single side (r), and quantified in (s) (n = 3 biologically independent samples). Values in (s) represent means ± SEM of three biologically independent samples, and statistical significance was determined by unpaired t test with two-sided analysis. Scale bar, 1000 µm (q) and 800 µm (r).
Fig. 4
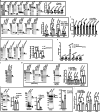
Fig. 4. Loss of DPH1 function upregulates p21 and PUMA by promoting eEF2-p53 complex formation and p53 binding to p21 and PUMA promoters.
Western blotting for the indicated proteins was carried out for the lysates of parental or DPH1-KO U251 cells (a), or U251 cells transfected with the indicated siRNA (b). Representative blots are shown on the left, and the quantification of n = 3 independent experiments is summarized in the graphs on the right. c RT-qPCR results for the indicated genes in U251 cells with and without DPH1 KD, n = 5 independent experiments. d, e Western blotting (n = 3 biologically independent mice) and RT-qPCR results (n = 3 biologically independent mice) for the indicated proteins and genes, respectively, in E10.5 wild-type (WT) and Dph1E237Q/Q41X mouse embryos. Co-IP of eEF2 and p53 in U251 cells. Lysates of untreated U251 cells (f) or cells transfected with the indicated siRNA (g) were processed for IP with an anti-eEF2 antibody, and western blotting (WB) was carried out for p53 and eEF2 (as control; n = 3 independent experiments). h Comparison of the amount of eEF2 in whole-cell lysates as well as ribosomal and nuclear fractions of parental and DPH1 KO U251 cells, as indicated, by western blotting (n = 3 independent experiments). i U251 cells were transfected with the indicated siRNA, and ChIP-qPCR was performed using a p53 antibody to quantify the amount of indicated promoter fragment associated with p53 (n = 3 independent experiments). Values represent means ± SEM in (a, b, c, d, e, g, h, i), and statistical significance was determined by unpaired t test with two-sided analysis.
Fig. 5
Fig. 5. Loss of one p21 allele rescues the growth and craniofacial phenotypes in Dph1E237Q/Q41X embryos.
a Comparison of a Dph1E237Q/Q41X p21+/− embryo with wild-type (WT), p21+/−, and Dph1E237Q/Q41X littermates at E15.5. While all Dph1E237Q/Q41X embryos show greatly reduced body size (n = 4), 67% of Dph1E237Q/Q41X p21+/− embryos (n = 9) exhibited enlarged body size as compare with their Dph1E237Q/Q41X littermates. Scale bar, 1000 μm. b-e At E15.5, palate was fused in 100% of wild-type (n = 4) or p21+/− (n = 5) embryos, 0% of Dph1E237Q/Q41X (n = 4) embryos, and 80% of Dph1E237Q/Q41X p21+/− embryos (n = 5). Scale bar, 250 μm. f A schematic diagram illustrates how diphthamide modification affects cell proliferation.

Similar articles

Cited by

References

    1. Liu S, et al. Diphthamide modification on eukaryotic elongation factor 2 is needed to assure fidelity of mRNA translation and mouse development. Proc. Natl Acad. Sci. USA. 2012;109:13817–13822. doi: 10.1073/pnas.1206933109. - DOI - PMC - PubMed
    1. Tsuda-Sakurai K, Miura M. The hidden nature of protein translational control by diphthamide: the secrets under the leather. J. Biochem. 2019;165:1–8. doi: 10.1093/jb/mvy071. - DOI - PubMed
    1. Fenwick MK, Dong M, Lin H, Ealick SE. The crystal structure of Dph2 in complex with elongation factor 2 reveals the structural basis for the first step of diphthamide biosynthesis. Biochemistry. 2019;58:4343–4351. doi: 10.1021/acs.biochem.9b00718. - DOI - PMC - PubMed
    1. Hawer H, et al. Diphthamide-deficiency syndrome: a novel human developmental disorder and ribosomopathy. Eur. J. Hum. Genet. 2020;28:1497–1508. doi: 10.1038/s41431-020-0668-y. - DOI - PMC - PubMed
    1. Alazami AM, et al. Accelerating novel candidate gene discovery in neurogenetic disorders via whole-exome sequencing of prescreened multiplex consanguineous families. Cell Rep. 2015;10:148–161. doi: 10.1016/j.celrep.2014.12.015. - DOI - PubMed

Publication types

MeSH terms