. 2024 Apr 26;14(1):9640.
doi: 10.1038/s41598-024-60016-7.

Erythromycin mediates co-flocculation between cyanobacterium Synechocystis sp. PCC 6803 and filamentous fungi in liquid cultivation without organic compounds

Affiliations

Erythromycin mediates co-flocculation between cyanobacterium Synechocystis sp. PCC 6803 and filamentous fungi in liquid cultivation without organic compounds

Panutchaya Pichaiyotinkul et al. Sci Rep. .

Abstract

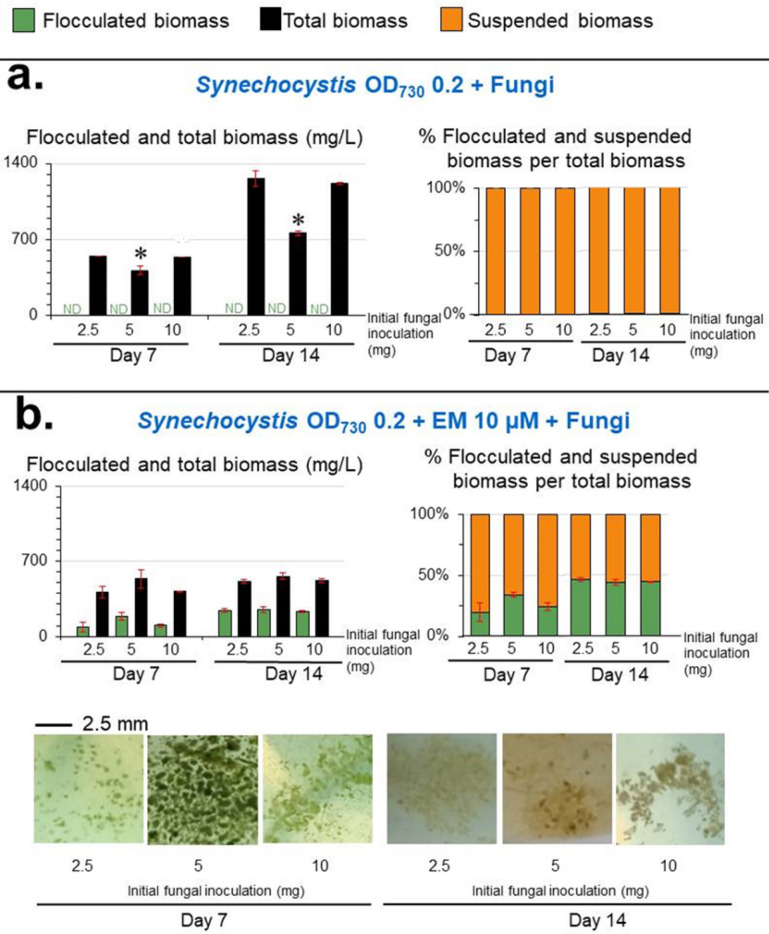
Photoautotrophic cyanobacteria assimilate the greenhouse gas carbon dioxide as their sole carbon source for producing useful bioproducts. However, harvesting the cells from their liquid media is a major bottleneck in the process. Thus, an easy-to-harvest method, such as auto-flocculation, is desirable. Here, we found that cyanobacterium Synechocystis sp. PCC 6803 co-flocculated with a natural fungal contamination in the presence of the antibiotic erythromycin (EM) but not without EM. The fungi in the co-flocculated biomass were isolated and found to consist of five species with the filamentous Purpureocillium lilacinum and Aspergillus protuberus making up 71% of the overall fungal population. The optimal co-cultivation for flocculation was an initial 5 mg (fresh weight) of fungi, an initial cell density of Synechocystis of 0.2 OD730, 10 µM EM, and 14 days of cultivation in 100 mL of BG11 medium with no organic compound. This yielded 248 ± 28 mg/L of the Synechocystis-fungi flocculated biomass from 560 ± 35 mg/L of total biomass, a 44 ± 2% biomass flocculation efficiency. Furthermore, the EM treated Synechocystis cells in the Synechocystis-fungi flocculate had a normal cell color and morphology, while those in the axenic suspension exhibited strong chlorosis. Thus, the occurrence of the Synechocystis-fungi flocculation was mediated by EM, and the co-flocculation with the fungi protected Synechocystis against the development of chlorosis. Transcriptomic analysis suggested that the EM-mediated co-flocculation was a result of down-regulation of the minor pilin genes and up-regulation of several genes including the chaperone gene for pilin regulation, the S-layer protein genes, the exopolysaccharide-polymerization gene, and the genes for signaling proteins involved in cell attachment and abiotic-stress responses. The CuSO4 stress can also mediate Synechocystis-fungi flocculation but at a lower flocculation efficiency than that caused by EM. The EM treatment may be applied in the co-culture between other cyanobacteria and fungi to mediate cell bio-flocculation.

Keywords: Antibiotic; Cell harvest; Cyanobacteria; Flocculation; Gene expression; Stress.


Conflict of interest statement

The authors declare no competing interests.

Figures

Figure 1
Figure 1
Outlines of the experimental procedures. (a) Flocculated biomass derived from the co-existence of Synechocystis and fungi was found in a Synechocystis culture under 10 μM EM treatment with a natural fungal contamination. (b) The flocculated biomass from (a) was streaked onto agar medium to isolate the fungi. (c) Co-cultivation between Synechocystis and the isolated fungi obtained from (b). This cultivation was optimized for the maximal level of flocculated biomass with respect to the three indicated factors. (d) The optimal co-cultivation yielding the maximal flocculated biomass was subjected to fungal classification by fungal ITS rDNA sequencing, Synechocystis transcriptomic analysis, and microscopic examination.
Figure 2
Figure 2
Culture and microscopic examination of Synechocystis-fungi flocculation. (a) Isolated fungi cultured on agar medium, as obtained from the procedure described in Fig. 1b. (b) Isolated fungi seen under bright-field (left) and fluorescent (right) microscopy. (c) Axenic Synechocystis cultured without EM. (d) Axenic Synechocystis from (c) as seen by bright-field microscopy (left) and fluorescent microscopy (right) showing the red light resulting from the auto-fluorescence of chlorophyll. (e) Co-cultivation between Synechocystis and the fungi with 10 µM EM showing Synechocystis-fungi flocculation. (f) Synechocystis-fungi flocculated biomass visualized by bright-field microscopy. (g, h) Synechocystis-fungi flocculated biomass as seen by bright-field microscopy (left) and fluorescent microscopy (right) showing the red light resulting from auto-fluorescence of Synechocystis chlorophyll.
Figure 3
Figure 3
Effect of the EM concentration on the levels of Synechocystis-fungi flocculation. Total biomass is the sum of flocculated and suspended biomasses. Values are shown as the mean ± 1SD (n = 4). ND = not detected. (a) Axenic cultivation of Synechocystis at an initial cell density of OD730 = 0.2 in the presence of various EM concentrations. Representative images of the culture flasks are shown. Significantly different levels (*P < 0.05: two-tailed student’s t-test) between the EM-treated cells and the untreated cells at the same cultivation time and the same type of biomass. Representative images of the respective cultivation (culture flasks) are shown. (b) Co-cultivation between Synechocystis (fixed initial cell density of OD730 = 0.2) and the fungi (fixed initial fungi inoculation of 5 mg fresh weight/100 mL) in the presence of various EM concentrations. Significantly different levels (*P < 0.05: two-tailed student’s t-test) between the EM-treated cells and the untreated cells at the same cultivation time and the same type of biomass. Representative images showing cell flocculation from the respective cultivation are shown.
Figure 4
Figure 4
Effect of initial Synechocystis density on the levels of Synechocystis-fungi flocculation. Total biomass is the sum of flocculated and suspended biomasses. Values are shown as the mean ± 1SD (n = 4), and ND = not detected. (a) Axenic cultivation of various initial Synechocystis densities in the presence of 10 µM EM. Significantly different levels (*P < 0.05: two-tailed student’s t-test), compared to that of the initial Synechocystis inoculation at OD730nm = 0.1 of the same cultivation time and the same type of biomass. (b) Co-cultivation between various Synechocystis densities and the fungi (fixed initial fungi inoculation of 5 mg fresh weight/100 mL) in the presence of 10 µM EM. Significantly different levels (*P < 0.05: two-tailed student’s t-test) compared to that of the initial Synechocystis inoculation at OD730nm = 0.1 at the same cultivation time and the same type of biomass. Representative images of the cell flocculation from the respective cultivation are shown.
Figure 5
Figure 5
Effect of initial fungi amount on the levels of Synechocystis-fungi flocculation. Total biomass is the sum of flocculated and suspended biomasses. Values are shown as the mean ± 1SD (n = 4), and ND = not detected. (a) Co-cultivation of Synechocystis at an initial cell density of OD730 = 0.2 without EM and with the initial fungal inoculation at 2.5, 5, and 10 mg fresh weight/100 mL. Significantly different levels (*P < 0.05: two-tailed student’s t-test), compared to that of the initial fungal inoculation at 2.5 mg/100 mL of the same cultivation time and the same type of biomass. (b) Co-cultivation of Synechocystis (fixed initial density of OD730 = 0.2) and initial fungal inoculation at 2.5, 5, and 10 mg fresh weight/100 mL with 10 µM EM. Significantly different levels (*P < 0.05: two-tailed student’s t-test) compared to that of the initial fungal inoculation at 2.5 mg/100 mL at the same cultivation time and the same type of biomass. Representative images of the cell flocculation from the respective culture are shown.
Figure 6
Figure 6
Synechocystis responsive genes in the flocculated cells. (a) Synechocystis responsive genes under flocculation. Synechocystis transcriptomics were compared between Synechocystis in [the Synechocystis-fungi flocculated biomass with EM] and [axenic suspended Synechocystis without EM]. The Synechocystis-fungi flocculated biomass was obtained from the co-cultivation between Synechocystis (initial density of OD730 = 0.2) and the fungi (initial inoculation of 5 mg fresh weight in 100 mL cultivation) in the presence of 10 µM EM. Axenic Synechocystis biomass was derived from the axenic culture using an initial density at OD730 = 0.2 without EM. The cultivation time is seven days. Data were obtained from three independent cultures. The transcriptomic data were analyzed, and the responsive genes were categorized by their cellular functions and metabolism using the Kyoto Encyclopedia of Genes and Genomes (KEGG; www.genome.jp/kegg/pathway.html). Names of the genes in each category of cellular processes are given in Supplementary Data S1. (b) Synechocystis-responsive genes under flocculation found in this study (shown in a) have also been reported to respond to other abiotic stresses: hydrogen peroxide, copper, cadmium, nitrogen deprivation, salt, and heat. Names of responsive genes in each stress are given in Supplementary Data S2.
Figure 7
Figure 7
Effect of the NaCl stress and CuSO4 stress on the Synechocystis-fungi flocculation. Total biomass is the sum of flocculated and suspended biomasses. Values are shown as the mean ± 1SD (n = 4). LD: low detection level at < 2 mg/L of the flocculated biomass or < 0.5% of percent flocculated biomass per total biomass. (a) Effect of the NaCl stress. Co-cultivation between Synechocystis (fixed initial cell density of OD730 = 0.2) and the fungi (fixed initial fungi inoculation of 5 mg fresh weight/100 mL) in the presence of NaCl at 1 or 2 M for 7 days. Culture: representative images of the culture flasks. (b) Effect of the CuSO4 stress. Co-cultivation between Synechocystis (fixed initial cell density of OD730 = 0.2) and the fungi (fixed initial fungi inoculation of 5 mg fresh weight/100 mL) in the presence of CuSO4 at 4 or 8 µM for 7 days. Culture: representative images of the culture flasks. Microscope: Synechocystis-fungi flocculated biomass as seen by bright-field microscopy (BF, left) and fluorescent microscopy (FL, right) showing the red light resulting from auto-fluorescence of Synechocystis chlorophyll. (c) The cultivation of the fungi (using the initial inoculation of 5 mg fresh weight/100 mL) in the BG11 medium without Synechocystis and without EM. The fresh weights of the fungi were dried to determine the dry weight.

References

    1. McCormick AJ, et al. Hydrogen production through oxygenic photosynthesis using the cyanobacterium Synechocystis sp. PCC 6803 in a bio-photoelectrolysis cell (BPE) system. Energy Environ. Sci. 2013;6:2682–2690. doi: 10.1039/c3ee40491a. - DOI
    1. Monshupanee T, Incharoensakdi A. Enhanced accumulation of glycogen, lipids and polyhydroxybutyrate under optimal nutrients and light intensities in the cyanobacterium Synechocystis sp. PCC 6803. J. Appl. Microbiol. 2014;116:830–838. doi: 10.1111/jam.12409. - DOI - PubMed
    1. Baebprasert W, Jantaro S, Khetkorn W, Lindblad P, Incharoensakdi A. Increased H2 production in the cyanobacterium Synechocystis sp. strain PCC 6803 by redirecting the electron supply via genetic engineering of the nitrate assimilation pathway. Metab. Eng. 2011;13:610–616. doi: 10.1016/j.ymben.2011.07.004. - DOI - PubMed
    1. Klotz A, et al. Awakening of a dormant cyanobacterium from nitrogen chlorosis reveals a genetically determined program. Curr. Biol. 2016;26:2862–2872. doi: 10.1016/j.cub.2016.08.054. - DOI - PubMed
    1. Fu P. Genome-scale modeling of Synechocystis sp. PCC 6803 and prediction of pathway insertion. J. Chem. Technol. Biotechnol. Int. Res. Process Environ. Clean Technol. 2009;84:473–483.

Publication types