

An individualized protein-based prognostic model to stratify pediatric patients with papillary thyroid carcinoma
- PMID: 38671151
- PMCID: PMC11053152
- DOI: 10.1038/s41467-024-47926-w
An individualized protein-based prognostic model to stratify pediatric patients with papillary thyroid carcinoma
Abstract
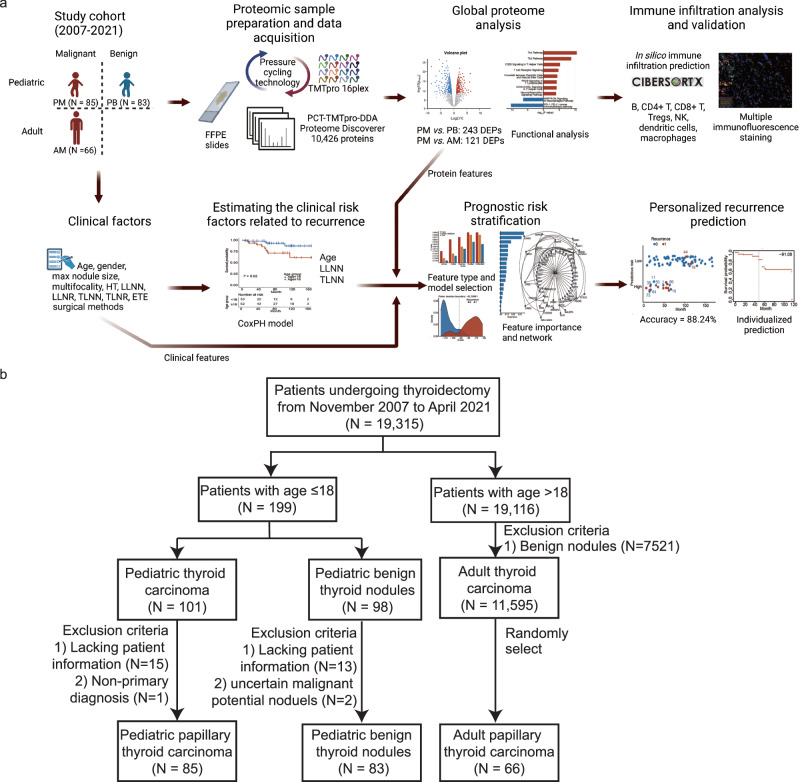
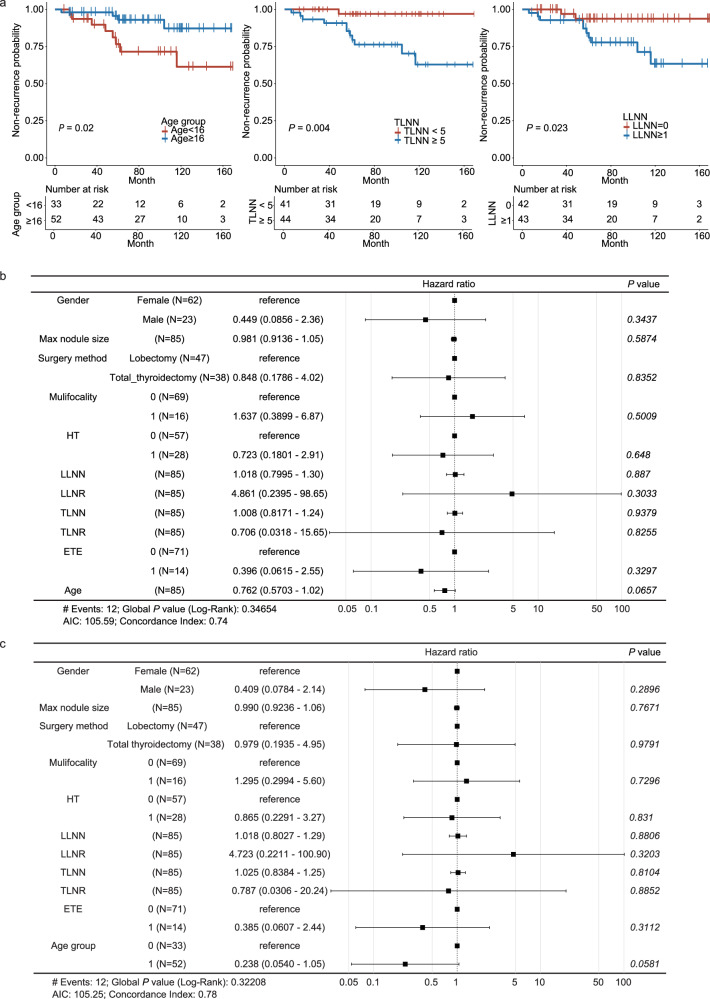
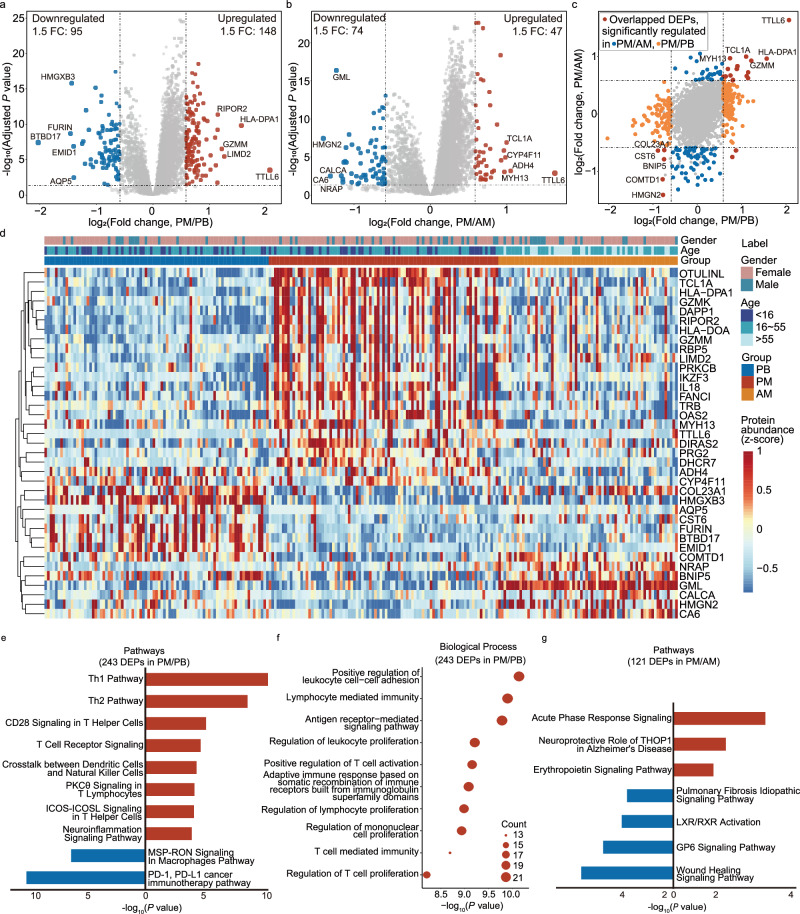
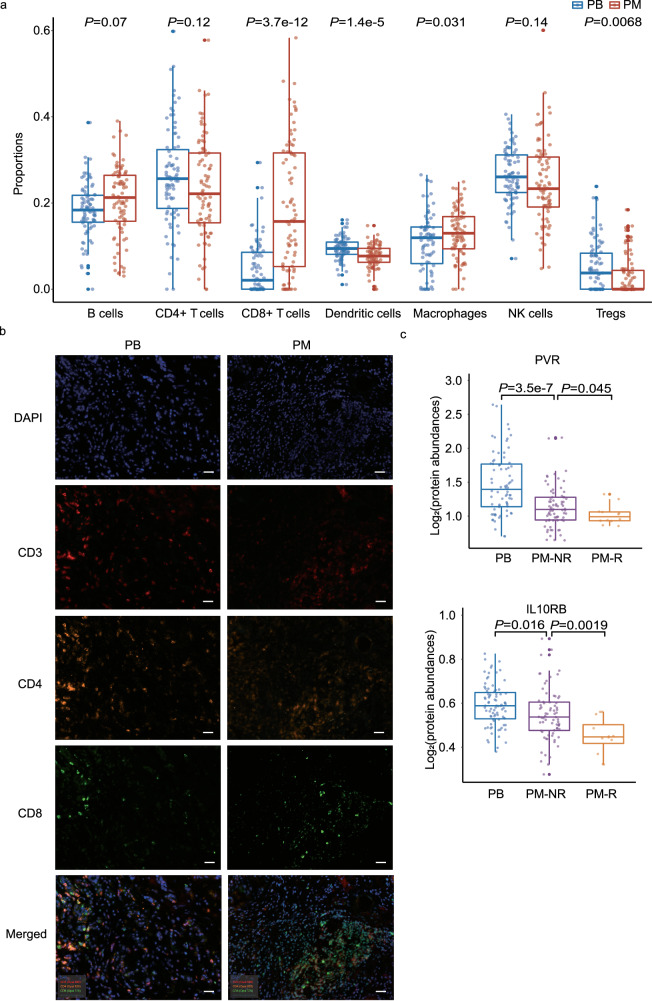
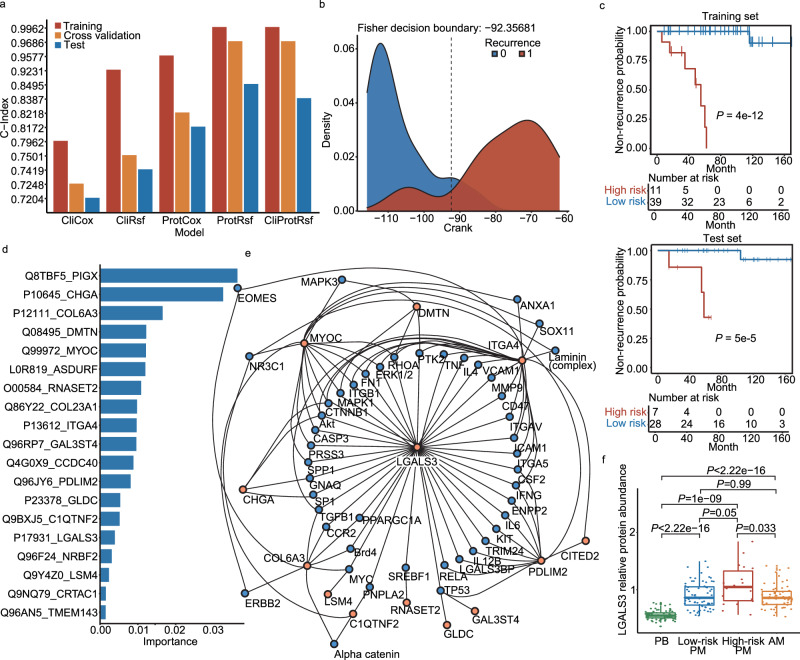
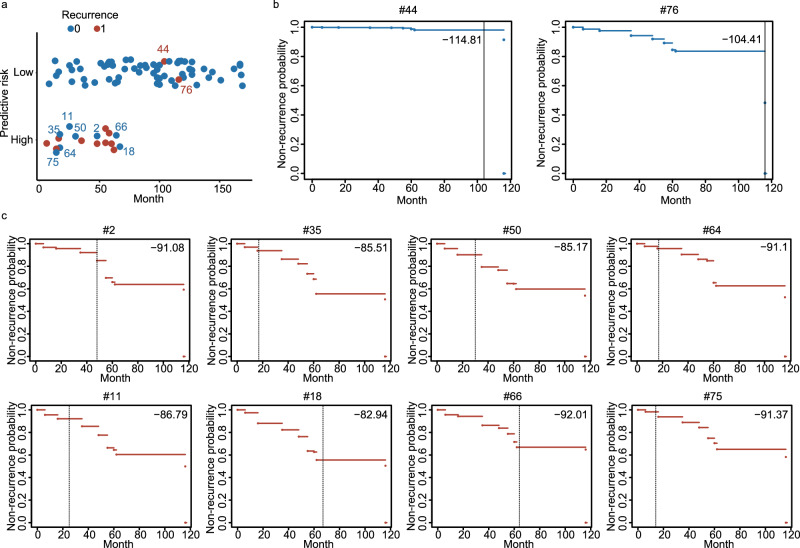
Pediatric papillary thyroid carcinomas (PPTCs) exhibit high inter-tumor heterogeneity and currently lack widely adopted recurrence risk stratification criteria. Hence, we propose a machine learning-based objective method to individually predict their recurrence risk. We retrospectively collect and evaluate the clinical factors and proteomes of 83 pediatric benign (PB), 85 pediatric malignant (PM) and 66 adult malignant (AM) nodules, and quantify 10,426 proteins by mass spectrometry. We find 243 and 121 significantly dysregulated proteins from PM vs. PB and PM vs. AM, respectively. Function and pathway analyses show the enhanced activation of the inflammatory and immune system in PM patients compared with the others. Nineteen proteins are selected to predict recurrence using a machine learning model with an accuracy of 88.24%. Our study generates a protein-based personalized prognostic prediction model that can stratify PPTC patients into high- or low-recurrence risk groups, providing a reference for clinical decision-making and individualized treatment.
© 2024. The Author(s).
Conflict of interest statement
T.G. and Y. Zhu are shareholders of Westlake Omics Inc. C.W. and L.T. are employees of Westlake Omics Inc. Z.W., Y.S., H. Wang, H.Z., and T.G. have applied for a patent [No. ZL 2022 1 1075844.3] on this project. The remaining authors declare no competing interests.
Figures
Similar articles
-
DICER1 Mutations Occur in More Than One-Third of Follicular-Patterned Pediatric Papillary Thyroid Carcinomas and Correlate with a Low-Risk Disease and Female Gender Predilection.Endocr Pathol. 2022 Dec;33(4):437-445. doi: 10.1007/s12022-022-09736-y. Epub 2022 Oct 17. Endocr Pathol. 2022. PMID: 36251117
-
Diverse Oncogenic Fusions and Distinct Gene Expression Patterns Define the Genomic Landscape of Pediatric Papillary Thyroid Carcinoma.Cancer Res. 2021 Nov 15;81(22):5625-5637. doi: 10.1158/0008-5472.CAN-21-0761. Epub 2021 Sep 17. Cancer Res. 2021. PMID: 34535459
-
Machine learning-based prediction model using clinico-pathologic factors for papillary thyroid carcinoma recurrence.Sci Rep. 2021 Mar 2;11(1):4948. doi: 10.1038/s41598-021-84504-2. Sci Rep. 2021. PMID: 33654166 Free PMC article.
-
Noninvasive Follicular Thyroid Neoplasm With Papillary-Like Nuclear Features in Children: An Institutional Experience and Literature Review.Pediatr Dev Pathol. 2020 Mar-Apr;23(2):121-126. doi: 10.1177/1093526619866584. Epub 2019 Sep 4. Pediatr Dev Pathol. 2020. PMID: 31483741 Review.
-
Programmed Death-Ligand 1 (PD-L1) Is a Potential Biomarker of Disease-Free Survival in Papillary Thyroid Carcinoma: a Systematic Review and Meta-Analysis of PD-L1 Immunoexpression in Follicular Epithelial Derived Thyroid Carcinoma.Endocr Pathol. 2020 Sep;31(3):291-300. doi: 10.1007/s12022-020-09630-5. Endocr Pathol. 2020. PMID: 32468210
Cited by
-
Individualizing the lifesaving journey for calciphylaxis: addressing rapidly progressive attacks with multidimensional and AI research for regenerative medicine.Ren Fail. 2024 Dec;46(2):2392846. doi: 10.1080/0886022X.2024.2392846. Epub 2024 Sep 5. Ren Fail. 2024. PMID: 39234636 Free PMC article. No abstract available.
-
Identification of prognostic genes related to T cell proliferation in papillary thyroid cancer based on single-cell RNA sequencing and bulk RNA sequencing data.Clin Exp Med. 2025 Aug 2;25(1):273. doi: 10.1007/s10238-025-01826-5. Clin Exp Med. 2025. PMID: 40753315 Free PMC article.
-
Development of a carbon nanoparticle-guided nomogram for predicting lateral cervical lymph node metastasis in clinically node-negative papillary thyroid carcinoma.Am J Transl Res. 2025 Jul 25;17(7):5625-5640. doi: 10.62347/JVGT3596. eCollection 2025. Am J Transl Res. 2025. PMID: 40821066 Free PMC article.
-
A protein-based classifier for differentiating follicular thyroid adenoma and carcinoma.EMBO Mol Med. 2025 Jul;17(7):1519-1538. doi: 10.1038/s44321-025-00242-2. Epub 2025 May 29. EMBO Mol Med. 2025. PMID: 40442320 Free PMC article.
-
Comprehensive Mass Spectral Libraries of Human Thyroid Tissues and Cells.Sci Data. 2024 Dec 28;11(1):1448. doi: 10.1038/s41597-024-04322-9. Sci Data. 2024. PMID: 39732735 Free PMC article.
References
Publication types
MeSH terms
Substances
LinkOut - more resources
Full Text Sources
Medical
