

Using functional principal component analysis (FPCA) to quantify sitting patterns derived from wearable sensors
- PMID: 38671485
- PMCID: PMC11055353
- DOI: 10.1186/s12966-024-01585-8
Using functional principal component analysis (FPCA) to quantify sitting patterns derived from wearable sensors
Abstract
Background: Sedentary behavior (SB) is a recognized risk factor for many chronic diseases. ActiGraph and activPAL are two commonly used wearable accelerometers in SB research. The former measures body movement and the latter measures body posture. The goal of the current study is to quantify the pattern and variation of movement (by ActiGraph activity counts) during activPAL-identified sitting events, and examine associations between patterns and health-related outcomes, such as systolic and diastolic blood pressure (SBP and DBP).
Methods: The current study included 314 overweight postmenopausal women, who were instructed to wear an activPAL (at thigh) and ActiGraph (at waist) simultaneously for 24 hours a day for a week under free-living conditions. ActiGraph and activPAL data were processed to obtain minute-level time-series outputs. Multilevel functional principal component analysis (MFPCA) was applied to minute-level ActiGraph activity counts within activPAL-identified sitting bouts to investigate variation in movement while sitting across subjects and days. The multilevel approach accounted for the nesting of days within subjects.
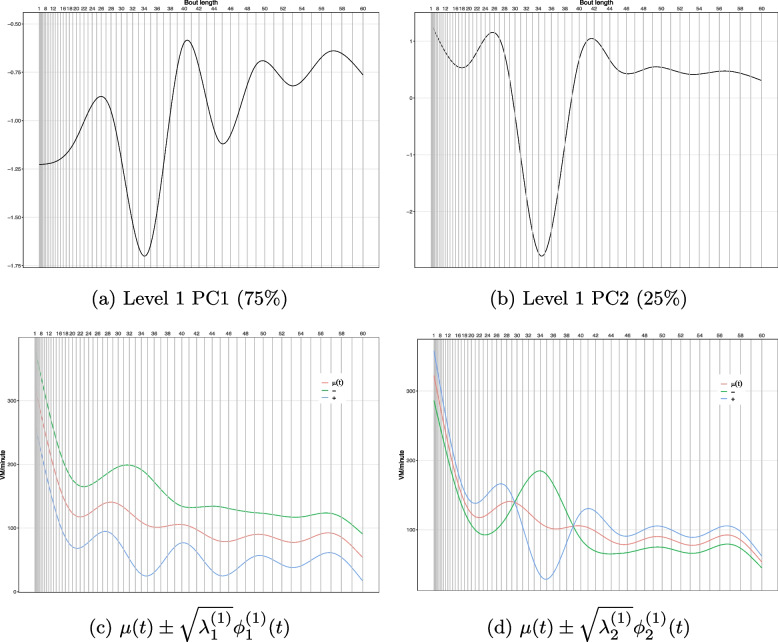
Results: At least 90% of the overall variation of activity counts was explained by two subject-level principal components (PC) and six day-level PCs, hence dramatically reducing the dimensions from the original minute-level scale. The first subject-level PC captured patterns of fluctuation in movement during sitting, whereas the second subject-level PC delineated variation in movement during different lengths of sitting bouts: shorter (< 30 minutes), medium (30 -39 minutes) or longer (> 39 minute). The first subject-level PC scores showed positive association with DBP (standardized : 2.041, standard error: 0.607, adjusted p = 0.007), which implied that lower activity counts (during sitting) were associated with higher DBP.
Conclusion: In this work we implemented MFPCA to identify variation in movement patterns during sitting bouts, and showed that these patterns were associated with cardiovascular health. Unlike existing methods, MFPCA does not require pre-specified cut-points to define activity intensity, and thus offers a novel powerful statistical tool to elucidate variation in SB patterns and health.
Trial registration: ClinicalTrials.gov NCT03473145; Registered 22 March 2018; https://clinicaltrials.gov/ct2/show/NCT03473145 ; International Registered Report Identifier (IRRID): DERR1-10.2196/28684.
Keywords: Accelerometer; Functional Principal Component Analysis (FPCA); Multilevel FPCA; Sedentary Behavior (SB).
© 2024. The Author(s).
Conflict of interest statement
The authors declare no potential conflict of interests.
Figures


Similar articles
-
Agreement Between TDK Silmee W22 and ActiGraph wGT3X-BT for Estimating Daily Step Counts and Moderate to Vigorous Physical Activity in Free-Living Adults: Comparative Study.JMIR Form Res. 2025 Jul 30;9:e64602. doi: 10.2196/64602. JMIR Form Res. 2025. PMID: 40737677 Free PMC article.
-
Impacts of Reducing Sitting Time or Increasing Sit-to-Stand Transitions on Blood Pressure and Glucose Regulation in Postmenopausal Women: Three-Arm Randomized Controlled Trial.Circulation. 2025 Aug 26;152(8):492-504. doi: 10.1161/CIRCULATIONAHA.124.073385. Epub 2025 Jul 25. Circulation. 2025. PMID: 40709462 Free PMC article. Clinical Trial.
-
Comparison of ActiGraph CentrePoint Insight Watch Placement on Dominant and Nondominant Wrists in Young Adults in Free-Living Conditions: Observational Validation Study.JMIR Mhealth Uhealth. 2025 Aug 11;13:e63033. doi: 10.2196/63033. JMIR Mhealth Uhealth. 2025. PMID: 40793819 Free PMC article.
-
Workplace interventions for reducing sitting at work.Cochrane Database Syst Rev. 2018 Jun 20;6(6):CD010912. doi: 10.1002/14651858.CD010912.pub4. Cochrane Database Syst Rev. 2018. Update in: Cochrane Database Syst Rev. 2018 Dec 17;12:CD010912. doi: 10.1002/14651858.CD010912.pub5. PMID: 29926475 Free PMC article. Updated.
-
Community wide interventions for increasing physical activity.Cochrane Database Syst Rev. 2015 Jan 5;1(1):CD008366. doi: 10.1002/14651858.CD008366.pub3. Cochrane Database Syst Rev. 2015. PMID: 25556970 Free PMC article.
Cited by
-
The relation of activity patterns with incident slow gait speed over 4 years in adults with knee osteoarthritis: Data from the Osteoarthritis Initiative.Osteoarthritis Cartilage. 2025 Sep;33(9):1121-1129. doi: 10.1016/j.joca.2025.06.002. Epub 2025 Jun 6. Osteoarthritis Cartilage. 2025. PMID: 40484272
-
Comparative Analysis of Force-Sensitive Resistors and Triaxial Accelerometers for Sitting Posture Classification.Sensors (Basel). 2024 Dec 2;24(23):7705. doi: 10.3390/s24237705. Sensors (Basel). 2024. PMID: 39686242 Free PMC article.
