. 2024 Apr 26;22(1):389.
doi: 10.1186/s12967-024-05211-w.

Deciphering the role of FUS::DDIT3 expression and tumor microenvironment in myxoid liposarcoma development

Affiliations

Deciphering the role of FUS::DDIT3 expression and tumor microenvironment in myxoid liposarcoma development

Parmida Ranji et al. J Transl Med. .

Abstract

Background: Myxoid liposarcoma (MLS) displays a distinctive tumor microenvironment and is characterized by the FUS::DDIT3 fusion oncogene, however, the precise functional contributions of these two elements remain enigmatic in tumor development.

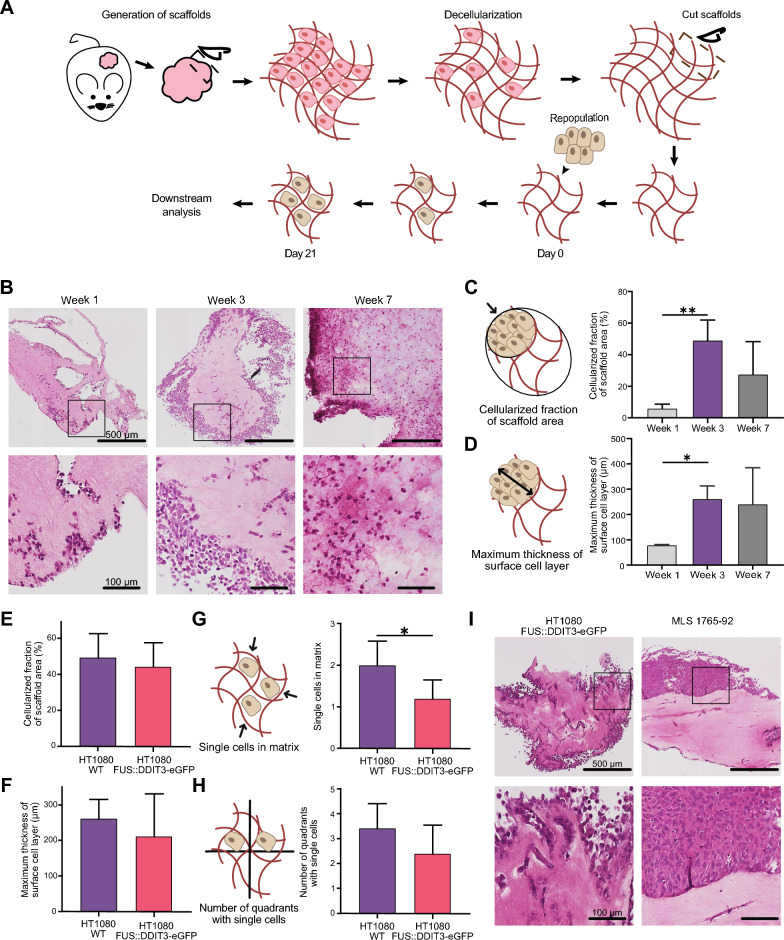
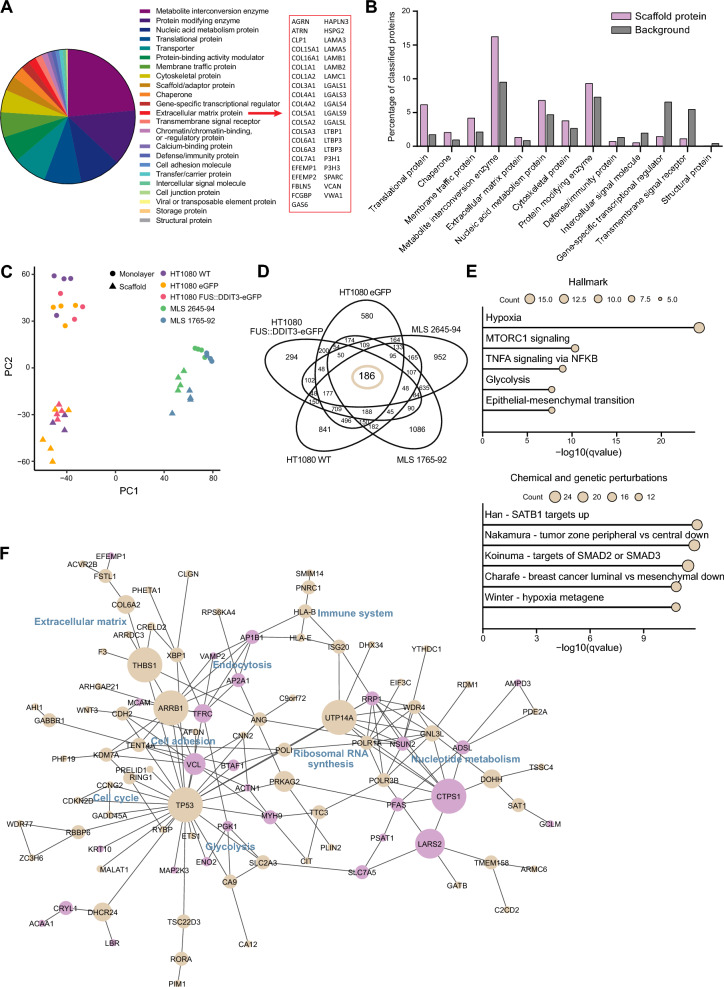
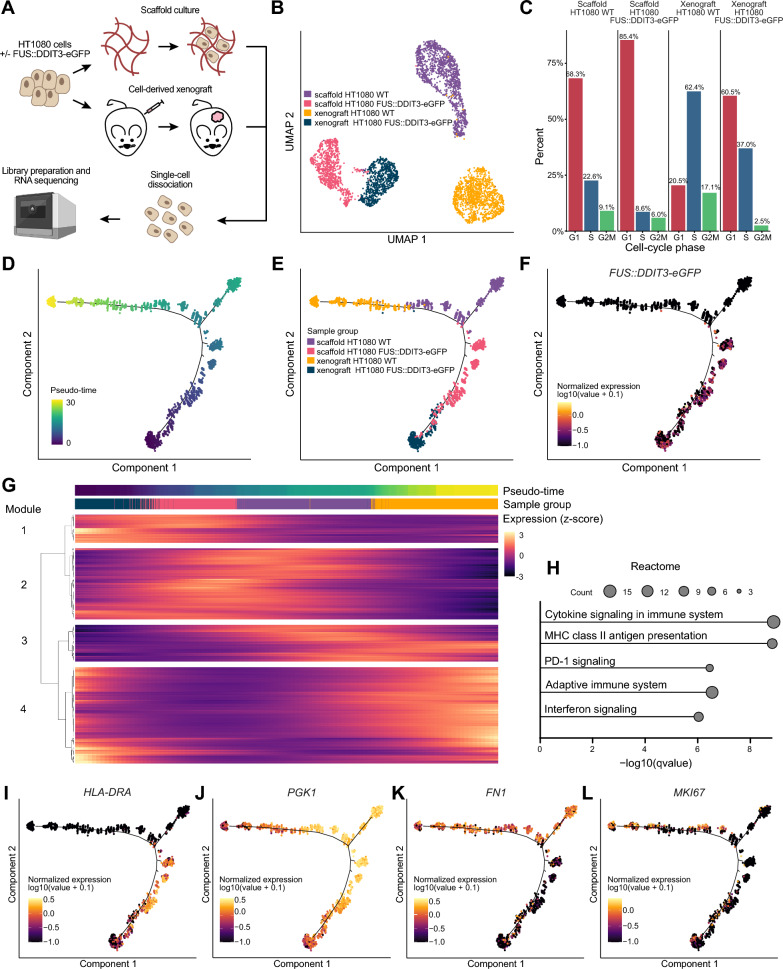
Methods: To study the cell-free microenvironment in MLS, we developed an experimental model system based on decellularized patient-derived xenograft tumors. We characterized the cell-free scaffold using mass spectrometry. Subsequently, scaffolds were repopulated using sarcoma cells with or without FUS::DDIT3 expression that were analyzed with histology and RNA sequencing.

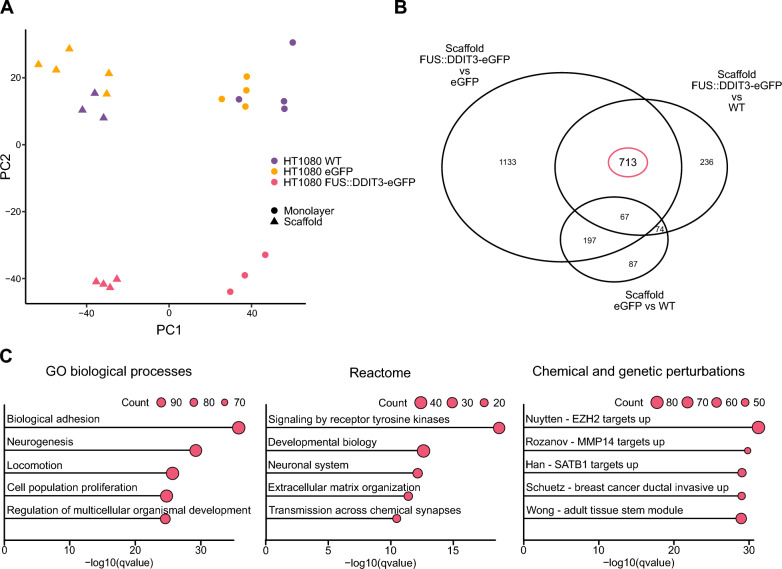
Results: Characterization of cell-free MLS scaffolds revealed intact structure and a large variation of protein types remaining after decellularization. We demonstrated an optimal culture time of 3 weeks and showed that FUS::DDIT3 expression decreased cell proliferation and scaffold invasiveness. The cell-free MLS microenvironment and FUS::DDIT3 expression both induced biological processes related to cell-to-cell and cell-to-extracellular matrix interactions, as well as chromatin remodeling, immune response, and metabolism. Data indicated that FUS::DDIT3 expression more than the microenvironment determined the pre-adipocytic phenotype that is typical for MLS.

Conclusions: Our experimental approach opens new means to study the tumor microenvironment in detail and our findings suggest that FUS::DDIT3-expressing tumor cells can create their own extracellular niche.

Keywords: Extracellular matrix; FET fusion oncogenes; FUS::DDIT3; Microenvironment; Myxoid liposarcoma; Scaffold.


Conflict of interest statement

AS and GL are co-inventors of the patient-derived scaffold approach that is patent approved (EP3535421/US11840732). AS is board member and declares stock ownership in Tulebovaasta, Iscaff Pharma and SiMSen Diagnostics. GL is board member and declares stock ownership in Iscaff Pharma and Sortina Pharma.

Figures

Fig. 1
Fig. 1
Myxoid liposarcoma scaffolds as an in vivo-like growth model system to study the effect of fusion oncogene FUS::DDIT3. A The tumor tissue was cut into pieces (~ 6 × 6 × 6 mm) and then decellularized using two rounds of detergent washing and cut into smaller pieces (~ 2 × 2 × 2 mm). Cell-free scaffolds were repopulated by adding sarcoma cells of interest followed by 3 weeks of growth before downstream analysis. B Hematoxylin and eosin staining of myxoid liposarcoma (MLS) scaffolds repopulated with HT1080 wild-type (WT) cells cultured for 1, 3 and 7 weeks. Images below are representative magnifications. C, D Comparison of HT1080 WT cells after 1, 3 and 7 weeks of culture in scaffolds and quantification of C cellularized fraction of the scaffold area, calculated as the area covered by cells divided by the total area, and D maximum thickness of surface cell layer. Mean ± SEM is shown, n = 3–7. *p ≤ 0.05, **p ≤ 0.01, one-way ANOVA with Tukey’s multiple comparison test. EH Comparison of HT1080 cells with and without ectopic FUS::DDIT3-eGFP expression cultured in scaffolds for 3 weeks and quantification of E cellularized fraction of the scaffold area, F maximum thickness of surface cell layer, G the number of single cells migrating into the matrix, where the single cells inside the scaffold area was calculated (0 = 0 cells, 1 = 1–20 cells, 2 = 20–50 cells, 3 ≥ 51 cells), and H number of quadrants with single cells, where the scaffold area was divided into four quadrants and the number of quadrants containing at least 5 single cells were calculated. Mean ± SEM is shown, n = 5–7. *p < 0.05, Student’s t-test. I Hematoxylin and eosin staining of scaffolds repopulated with HT1080 cells with ectopic FUS::DDIT3-eGFP expression and MLS cell line 1765-92 cells both cultured for 3 weeks. Images below are representative magnifications
Fig. 2
Fig. 2
Myxoid liposarcoma scaffold protein composition and scaffold-induced gene expression. A Classification of proteins detected in myxoid liposarcoma (MLS) scaffolds (n = 4) using mass spectrometry analysis. Proteins were classified (n = 2172), according to the PANTHER protein classification. All proteins categorized as extracellular matrix protein (n = 41) are listed. B Significantly over- and underrepresented categories, comparing MLS scaffold proteins with all protein-coding genes (background) using PANTHER overrepresentation test with a false discovery rate < 0.05. The category order is based on fold enrichment with the highest overrepresentation in MLS scaffolds shown to the left. C Principal component analysis of transcriptional profiles based on RNA sequencing of MLS scaffold- and monolayer-cultured cells, respectively, for HT1080 wild-type (WT), HT1080 eGFP, HT1080 FUS::DDIT3-eGFP, MLS 2645-94 and MLS 1765-92, n = 3–5. D Venn diagram showing gene regulation overlaps between scaffold- and monolayer-cultured cells in respective cell line. E Functional enrichment analysis using the Hallmark and Chemical and genetic perturbations gene set collections for the 186 scaffold-regulated genes. Top 5 categories are shown based on q-value. Size of dots indicate gene count. F Interaction network of the 186 scaffold-regulated genes generated by Cytoscape based on protein interaction data retrieved from STRING. Node size is based on between-ness centrality, where a large node size indicates many interactions within the network. Purple nodes show proteins expressed in scaffolds. Common properties of adjacent proteins are indicated in blue, assessed from NCBI gene summary and UniProtKB/Swiss-Prot summary for each gene retrieved from GeneCards
Fig. 3
Fig. 3
FUS::DDIT3-induced gene expression signatures in myxoid liposarcoma scaffolds. A Principal component analysis of transcriptional profiles for HT1080 wild-type (WT), HT1080 eGFP and HT1080 FUS::DDIT3-eGFP cells cultured in either myxoid liposarcoma (MLS) scaffolds or monolayers. n = 3–5. B Venn diagram showing gene regulation overlap between HT1080 WT, HT1080 eGFP, and HT1080 FUS::DDIT3-eGFP cells cultured in MLS scaffolds. C Functional enrichment analysis using the 713 FUS::DDIT3-regulated genes using GO biological processes, Reactome and Chemical and genetic perturbations gene set collections. Top 5 categories are shown based on q-value. Size of dots indicate gene count
Fig. 4
Fig. 4
Single-cell analysis of cells grown in myxoid liposarcoma scaffolds and as cell-derived xenografts. A Experimental single-cell analysis workflow. B Uniform manifold approximation and projection (UMAP) analysis of individual HT1080 cells with and without FUS::DDIT3-eGFP expression grown in myxoid liposarcoma (MLS) scaffolds or as xenografts, n = 1387 (scaffold HT1080 wild-type (WT)), 894 (scaffold HT1080 FUS::DDIT3-eGFP), 1315 (xenograft HT1080 WT), 819 (xenograft HT1080 FUS::DDIT3-eGFP). C Bar chart illustrating the percentage of cells in each cell-cycle phase, G1, S and G2/M, based on known cell-cycle-associated genes, for each sample. DG Pseudo-time trajectory analysis performed with Monocle 2 using DDR-Tree for dimensional reduction. D Distribution of cells along the pseudo-time trajectory is shown. E Pseudo-time trajectory with marked sample group. F Expression of FUS::DDIT3-eGFP across the pseudo-time trajectory (estimated by measuring eGFP expression). G Significantly differentially expressed genes across pseudo-time are clustered based on co-expression into four modules. The color schemes for pseudo-time and sample group from subplots D and E are used. H Functional enrichment analysis using the Reactome gene set collection for the genes in module 1. Top 5 categories are shown based on q-value. Size of dots indicate gene count. IL Expression of selected genes across the pseudo-time trajectory, I HLA-DRA, J PGK1, K FN1 and L MKI67

Similar articles

Cited by

References

    1. WHO Classification of Tumours Editorial Board . Soft tissue and bone tumours. 5. Lyon: IARC Press; 2020.
    1. Riggi N, Cironi L, Suva ML, Stamenkovic I. Sarcomas: genetics, signalling, and cellular origins. Part 1: the fellowship of TET. J Pathol. 2007;213:4–20. - PubMed
    1. Åman P. Fusion oncogenes in tumor development. Semin Cancer Biol. 2005;15:236–243. - PubMed
    1. Hofvander J, Viklund B, Isaksson A, Brosjö O, Vult von Steyern F, Rissler P, Mandahl N, Mertens F. Different patterns of clonal evolution among different sarcoma subtypes followed for up to 25 years. Nat Commun. 2018;9:3662–3662. - PMC - PubMed
    1. Ståhlberg A, Gustafsson CK, Engtröm K, Thomsen C, Dolatabadi S, Jonasson E, Li CY, Ruff D, Chen SM, Åman P. Normal and functional TP53 in genetically stable myxoid/round cell liposarcoma. PLoS ONE. 2014;9:e113110. - PMC - PubMed

Publication types

MeSH terms