Comparison of Virtual Non-Contrast and True Non-Contrast CT Images Obtained by Dual-Layer Spectral CT in COPD Patients
- PMID: 38671723
- PMCID: PMC11047621
- DOI: 10.3390/bioengineering11040301
Comparison of Virtual Non-Contrast and True Non-Contrast CT Images Obtained by Dual-Layer Spectral CT in COPD Patients
Abstract
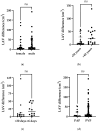
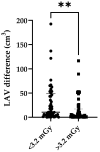
Chronic obstructive pulmonary disease (COPD) is one of the leading causes of death. Recent studies have underlined the importance of non-contrast-enhanced chest CT scans not only for emphysema progression quantification, but for correlation with clinical outcomes as well. As about 40 percent of the 300 million CT scans per year are contrast-enhanced, no proper emphysema quantification is available in a one-stop-shop approach for patients with known or newly diagnosed COPD. Since the introduction of spectral imaging (e.g., dual-energy CT scanners), it has been possible to create virtual non-contrast-enhanced images (VNC) from contrast-enhanced images, making it theoretically possible to offer proper COPD imaging despite contrast enhancing. This study is aimed towards investigating whether these VNC images are comparable to true non-contrast-enhanced images (TNC), thereby reducing the radiation exposure of patients and usage of resources in hospitals. In total, 100 COPD patients with two scans, one with (VNC) and one without contrast media (TNC), within 8 weeks or less obtained by a spectral CT using dual-layer technology, were included in this retrospective study. TNC and VNC were compared according to their voxel-density histograms. While the comparison showed significant differences in the low attenuated volumes (LAVs) of TNC and VNC regarding the emphysema threshold of -950 Houndsfield Units (HU), the 15th and 10th percentiles of the LAVs used as a proxy for pre-emphysema were comparable. Upon further investigation, the threshold-based LAVs (-950 HU) of TNC and VNC were comparable in patients with a water equivalent diameter (DW) below 270 mm. The study concludes that VNC imaging may be a viable option for assessing emphysema progression in COPD patients, particularly those with a normal body mass index (BMI). Further, pre-emphysema was generally comparable between TNC and VNC. This approach could potentially reduce radiation exposure and hospital resources by making additional TNC scans obsolete.
Keywords: COPD; computed tomography imaging; dual-layer spectral CT; emphysema quantification; image comparison analysis; lung imaging; radiation exposure; true non-contrast images; virtual non-contrast images.
Conflict of interest statement
The authors declare no conflict of interest.
Figures


References
-
- Vogelmeier C.F., Criner G.J., Martinez F.J., Anzueto A., Barnes P.J., Bourbeau J., Celli B.R., Chen R., Decramer M., Fabbri L.M., et al. Global Strategy for the Diagnosis, Management, and Prevention of Chronic Obstructive Lung Disease 2017 Report. GOLD Executive Summary. Am. J. Respir. Crit. Care Med. 2017;195:557–582. doi: 10.1164/rccm.201701-0218PP. - DOI - PubMed
-
- Heussel C.P., Herth F.J.F., Kappes J., Hantusch R., Hartlieb S., Weinheimer O., Kauczor H.U., Eberhardt R. Fully automatic quantitative assessment of emphysema in computed tomography: Comparison with pulmonary function testing and normal values. Eur. Radiol. 2009;19:2391–2402. doi: 10.1007/s00330-009-1437-z. - DOI - PubMed
-
- Coxson H.O., Dirksen A., Edwards L.D., Yates J.C., Agusti A., Bakke P., Calverley P.M., Celli B., Crim C., Duvoix A., et al. The presence and progression of emphysema in COPD as determined by CT scanning and biomarker expression: A prospective analysis from the ECLIPSE study. Lancet Respir. Med. 2013;1:129–136. doi: 10.1016/S2213-2600(13)70006-7. - DOI - PubMed
LinkOut - more resources
Full Text Sources
Research Materials
Miscellaneous

