. 2024 Mar 28;13(4):411.
doi: 10.3390/antiox13040411.

Obesogenic Diet in Mice Leads to Inflammation and Oxidative Stress in the Mother in Association with Sex-Specific Changes in Fetal Development, Inflammatory Markers and Placental Transcriptome

Affiliations

Obesogenic Diet in Mice Leads to Inflammation and Oxidative Stress in the Mother in Association with Sex-Specific Changes in Fetal Development, Inflammatory Markers and Placental Transcriptome

Alejandro A Candia et al. Antioxidants (Basel). .

Abstract

Background: Obesity during pregnancy is related to adverse maternal and neonatal outcomes. Factors involved in these outcomes may include increased maternal insulin resistance, inflammation, oxidative stress, and nutrient mishandling. The placenta is the primary determinant of fetal outcomes, and its function can be impacted by maternal obesity. The aim of this study on mice was to determine the effect of obesity on maternal lipid handling, inflammatory and redox state, and placental oxidative stress, inflammatory signaling, and gene expression relative to female and male fetal growth.

Methods: Female mice were fed control or obesogenic high-fat/high-sugar diet (HFHS) from 9 weeks prior to, and during, pregnancy. On day 18.5 of pregnancy, maternal plasma, and liver, placenta, and fetal serum were collected to examine the immune and redox states. The placental labyrinth zone (Lz) was dissected for RNA-sequencing analysis of gene expression changes.

Results: the HFHS diet induced, in the dams, hepatic steatosis, oxidative stress (reduced catalase, elevated protein oxidation) and the activation of pro-inflammatory pathways (p38-MAPK), along with imbalanced circulating cytokine concentrations (increased IL-6 and decreased IL-5 and IL-17A). HFHS fetuses were asymmetrically growth-restricted, showing sex-specific changes in circulating cytokines (GM-CSF, TNF-α, IL-6 and IFN-γ). The morphology of the placenta Lz was modified by an HFHS diet, in association with sex-specific alterations in the expression of genes and proteins implicated in oxidative stress, inflammation, and stress signaling. Placental gene expression changes were comparable to that seen in models of intrauterine inflammation and were related to a transcriptional network involving transcription factors, LYL1 and PLAG1.

Conclusion: This study shows that fetal growth restriction with maternal obesity is related to elevated oxidative stress, inflammatory pathways, and sex-specific placental changes. Our data are important, given the marked consequences and the rising rates of obesity worldwide.

Keywords: inflammation; obesogenic diet; oxidative stress; placenta; pregnancy; sex.


Conflict of interest statement

The authors declare that they have no competing interests.

Figures
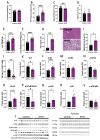
Figure 1
Figure 1
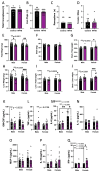
Maternal body composition and liver damage. Maternal pre-pregnancy weight (A); and adiposity (B). Maternal weight (C); and adiposity at E17.5 (D). Liver weight (E); liver to hysterectomy weight (F); percentage of fat content (G); representative picture of liver structure (H; 20× magnification; black scale bar = 100 µm); steatosis to liver area (I); and liver glycogen content (J). Maternal liver protein levels of catalase (CAT, K); 3-nitrotyrosine (3-NT, L); 4-Hydroxynonenal (4-HNE, M); phosphorylated p65-NFκB (N); total levels of p65-NFκB (O); phosphorylated to total p65-NFκB (P); phosphorylated p38 (Q); total p38 (R); phosphorylated to total p38 (S); and representative image of Western blots (T). Groups are controlled (Control, black bars, circles, n = 17 from AF; n = 7 from GT) and high-fat high-sugar diet (HFHS, magenta bars, triangles, n = 16 from AF; n = 7 from GT). Each dot represents one individual. Mean ± SEM is shown. The ROUT test was applied to identify outliers and Shapiro–Wilk was used to determine the normality of data. Data were submitted to the Student’s t-test or Mann–Whitney according to data distribution. * p ≤ 0.05; ** p < 0.005; *** p < 0.0005; **** p < 0.0001.
Figure 2
Figure 2
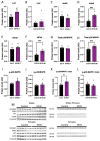
Cytokines, oxidative stress, and liver damage markers in maternal plasma. Maternal plasma levels of IL-17 (A); IL-6 (B); GM-CSF (C); IFN-γ (D); TNF-α (E); IL-5 (F); and IL-10 (G). Antioxidant capacity of plasma (H); and plasma levels of ALT (I); GDF15 (J); and AST (K). Groups are controlled (Control, black bars, circles n = 10) and high-fat high-sugar diet (HFHS, magenta bars, triangles, n = 10). Each dot represents one individual. Mean ± SEM is shown. The ROUT test was applied to identify outliers and Shapiro–Wilk was used to determine the normality of data. Data were submitted to the Mann–Whitney test. * p ≤ 0.05 vs. control.
Figure 3
Figure 3
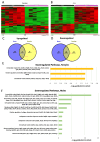
Fetal viability, growth, and inflammatory state. The total number of conceptuses (A); live pups (B); resorptions (C); and female-to-male ratio (D) at E18.5 are shown. Fetal weight (E); brain weight (F); brain-to-fetal weight ratio (G); liver weight (H); liver-to-fetal weight ratio (I); and brain-to-liver weight ratio (J) at E18.5 are shown. Fetal plasma levels of GM-CSF (K); TNF-α (L), IL-6 (M); IL-1α (N); MCP-1 (O); IL-10 (P); and IFN-γ (Q). Groups are controlled (Control, black bars, circles n = 17 per group from AD; n = 17 per group/sex from EJ; n = 10 per group/sex from KQ) and high-fat high-sugar diet (HFHS, magenta bars, triangles, n = 16 per group from AD; n = 16 per group/sex from EJ; n = 10 per group/sex from KQ). Each dot represents one litter (AD; K), the litter mean (EJ), or individual values (KQ). Mean ± SEM is shown. The ROUT test was applied to identify outliers and Shapiro–Wilk was used to determine the normality of data. Data were submitted to the Mann–Whitney test (AD), or two-way ANOVA and Tukey post hoc pairwise comparison (EQ). * p ≤ 0.05; ** p < 0.005; *** p < 0.0005 vs. control.
Figure 4
Figure 4
Placental labyrinth zone protein levels. Protein levels of catalase (CAT, A,B); 4-Hydroxynonenal (4-HNE, C,D); total levels of p65-NFκB (E,F); total p38 (G,H); phosphorylated p38 (I,J); phosphorylated to total p38 (K,L); and representative image of Western blots (M) from placental labyrinth zone of females (Ctrl F, HFHS F) and males (Ctrl M, HFHS M) are shown. Groups are control (Control, black bars, circles, n = 6) and high-fat high-sugar diet (HFHS, magenta bars, triangles, n = 6). Each dot represents one individual. Mean ± SEM is shown. The ROUT test was applied to identify outliers and Shapiro–Wilk was used to determine the normality of data. Data were submitted to the Student’s t-test or Mann–Whitney according to data distribution. * p ≤ 0.05; ** p < 0.005 vs. control.
Figure 5
Figure 5
Placental labyrinth zone gene expression. Heatmap of differentially expressed genes (DEGs) in females (A); and males (B). Green and red colors indicate low and high z-score, respectively. Venn diagram of upregulated (C); and downregulated (D) differentially expressed genes (DEGs) in the placenta of female and males determined by RNA-seq (p adjusted value < 0.05 and 0.5-linear fold expression change). Pathways significatively downregulated (p adjusted value < 0.05) by HFHS diet in the placenta of females (E); and male fetuses (F) determined by FDR < 0.5. Data are n = 6 per group per sex.
Figure 6
Figure 6
Predicted enriched transcription factors. Significantly enriched transcription factors, their motif, adjusted p-value, and percentage of genes regulated in each dataset from each comparison are shown.
Figure 7
Figure 7
Summary of main results. Maternal HFHS diet induces fatty liver, oxidative stress and inflammation in dams; alters morphology and Lz gene expression; and induces asymmetric growth restriction and altered inflammatory markers in fetuses. Grey arrows pointing upwards indicate significant increase in HFHS group. Grey arrows pointing downwards indicate significant decrease in HFHS diet group. ♀: significant changes only in females. ♂: significant changes only in males.

References

    1. Poston L., Caleyachetty R., Cnattingius S., Corvalán C., Uauy R., Herring S., Gillman M.W. Preconceptional and Maternal Obesity: Epidemiology and Health Consequences. Lancet Diabetes Endocrinol. 2016;4:1025–1036. doi: 10.1016/S2213-8587(16)30217-0. - DOI - PubMed
    1. Marchi J., Berg M., Dencker A., Olander E.K., Begley C. Risks Associated with Obesity in Pregnancy, for the Mother and Baby: A Systematic Review of Reviews. Obes. Rev. 2015;16:621–638. doi: 10.1111/obr.12288. - DOI - PubMed
    1. Sasson I.E., Vitins A.P., Mainigi M.A., Moley K.H., Simmons R.A. Pre-Gestational vs Gestational Exposure to Maternal Obesity Differentially Programs the Offspring in Mice. Diabetologia. 2015;58:615–624. doi: 10.1007/s00125-014-3466-7. - DOI - PMC - PubMed
    1. Lewandowska M. Maternal Obesity and Risk of Low Birth Weight, Fetal Growth Restriction, and Macrosomia: Multiple Analyses. Nutrients. 2021;13:1213. doi: 10.3390/nu13041213. - DOI - PMC - PubMed
    1. Lacroix M., Kina E., Hivert M.F. Maternal/Fetal Determinants of Insulin Resistance in Women during Pregnancy and in Offspring over Life. Curr. Diab. Rep. 2013;13:238–244. doi: 10.1007/s11892-012-0360-x. - DOI - PubMed