

Redox Regulation of LAT Enhances T Cell-Mediated Inflammation
- PMID: 38671946
- PMCID: PMC11047684
- DOI: 10.3390/antiox13040499
Redox Regulation of LAT Enhances T Cell-Mediated Inflammation
Abstract
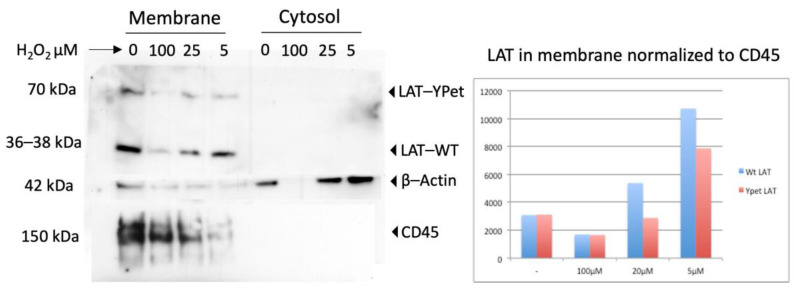
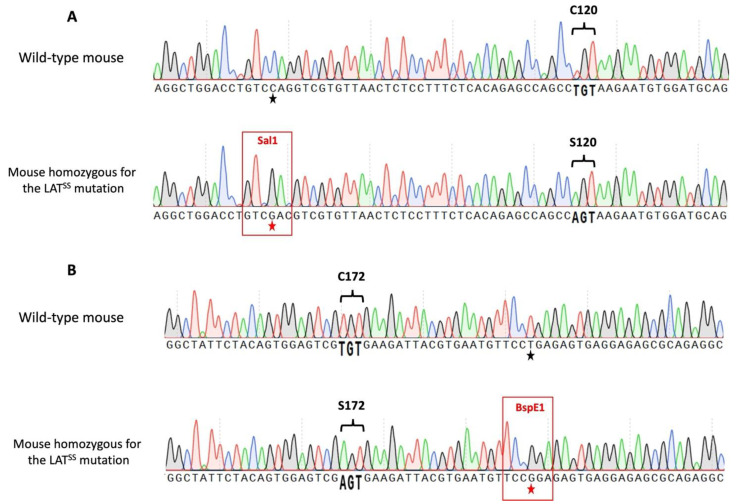
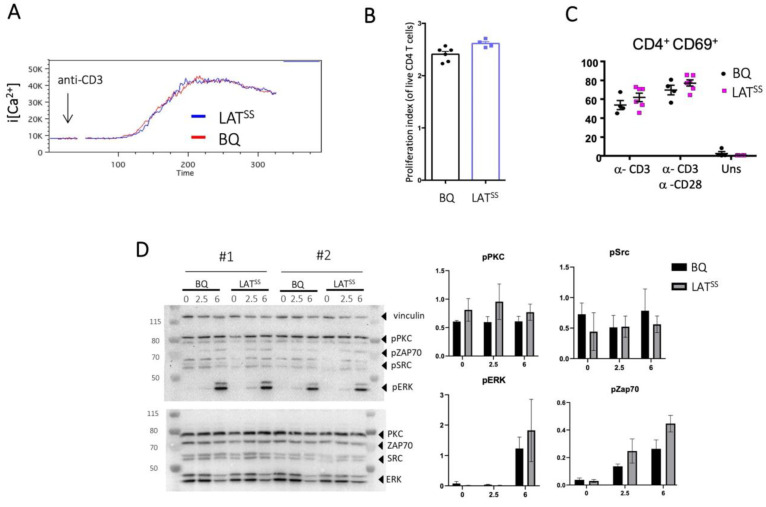
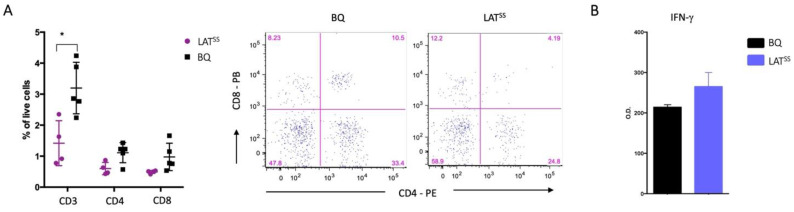
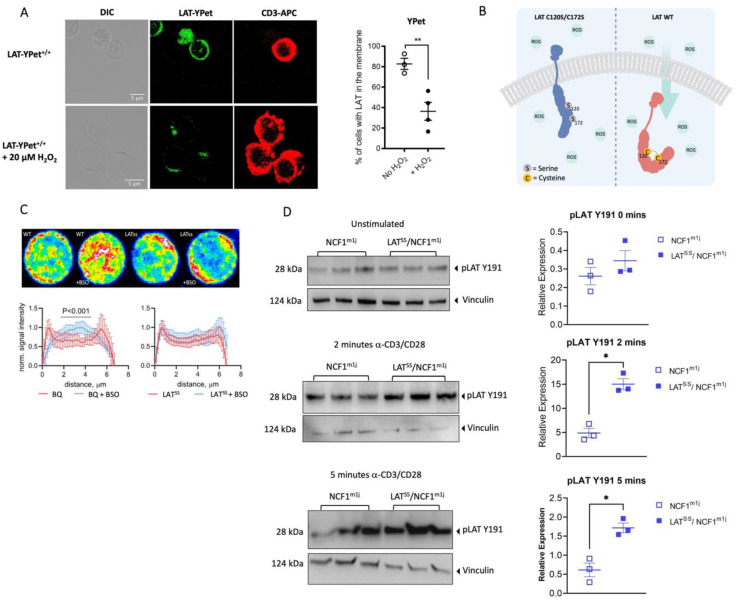
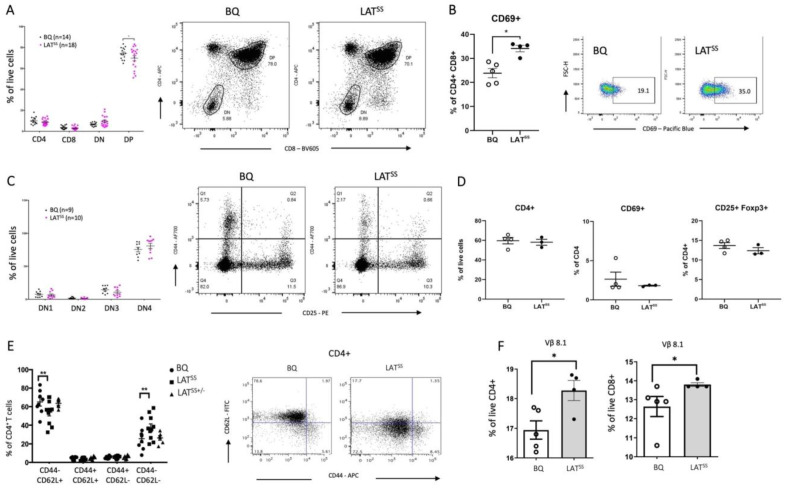
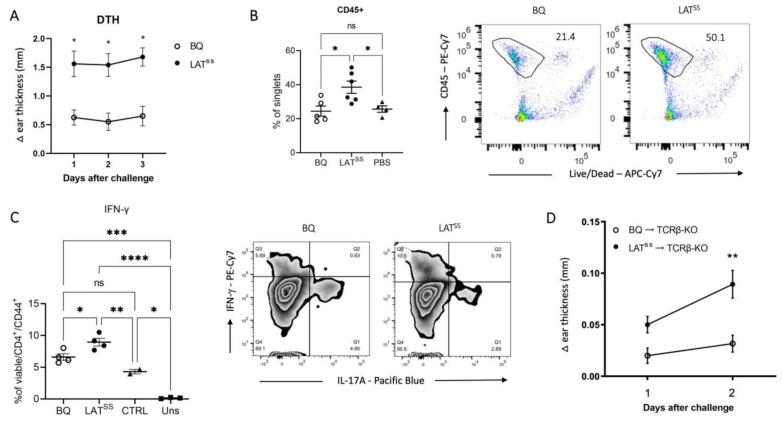
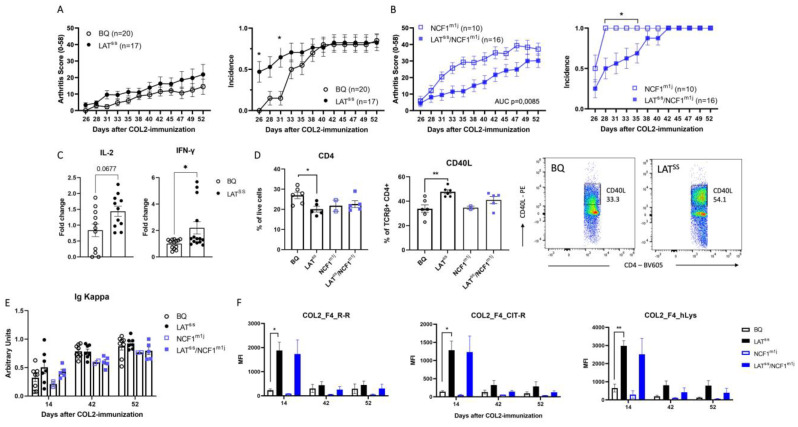
The positional cloning of single nucleotide polymorphisms (SNPs) of the neutrophil cytosolic factor 1 (Ncf1) gene, advocating that a low oxidative burst drives autoimmune disease, demands an understanding of the underlying molecular causes. A cellular target could be T cells, which have been shown to be regulated by reactive oxygen species (ROS). However, the pathways by which ROS mediate T cell signaling remain unclear. The adaptor molecule linker for activation of T cells (LAT) is essential for coupling T cell receptor-mediated antigen recognition to downstream responses, and it contains several cysteine residues that have previously been suggested to be involved in redox regulation. To address the possibility that ROS regulate T cell-dependent inflammation through LAT, we established a mouse strain with cysteine-to-serine mutations at positions 120 and 172 (LATSS). We found that redox regulation of LAT through C120 and C172 mediate its localization and phosphorylation. LATSS mice had reduced numbers of double-positive thymocytes and naïve peripheral T cells. Importantly, redox insensitivity of LAT enhanced T cell-dependent autoimmune inflammation in collagen-induced arthritis (CIA), a mouse model of rheumatoid arthritis (RA). This effect was reversed on an NCF1-mutated (NCF1m1j), ROS-deficient, background. Overall, our data show that LAT is redox-regulated, acts to repress T cell activation, and is targeted by ROS induced by NCF1 in antigen-presenting cells (APCs).
Keywords: NCF1; T cell receptor signaling; linker for activation of T cells; reactive oxygen species; rheumatoid arthritis.
Conflict of interest statement
Florian Forster is currently employed at the company SCIOTEC Diagnostic Technologies GmbH, Tulln, Austria. The company had no role in the design of this study; the collection, analysis, and interpretation of the data; the writing of this manuscript; or the decision to publish the results. The remaining authors declare no conflict of interest.
Figures
Similar articles
-
Reactive Oxygen Species Regulate Both Priming and Established Arthritis, but with Different Mechanisms.Antioxid Redox Signal. 2017 Dec 20;27(18):1473-1490. doi: 10.1089/ars.2016.6981. Epub 2017 Jun 1. Antioxid Redox Signal. 2017. PMID: 28467721
-
NCF4 regulates antigen presentation of cysteine peptides by intracellular oxidative response and restricts activation of autoreactive and arthritogenic T cells.Redox Biol. 2024 Jun;72:103132. doi: 10.1016/j.redox.2024.103132. Epub 2024 Mar 26. Redox Biol. 2024. PMID: 38547647 Free PMC article.
-
Ncf1 Governs Immune Niches in the Lung to Mediate Pulmonary Inflammation in Mice.Front Immunol. 2021 Dec 14;12:783944. doi: 10.3389/fimmu.2021.783944. eCollection 2021. Front Immunol. 2021. PMID: 34970267 Free PMC article.
-
Bridging the Gap: Modulatory Roles of the Grb2-Family Adaptor, Gads, in Cellular and Allergic Immune Responses.Front Immunol. 2019 Jul 25;10:1704. doi: 10.3389/fimmu.2019.01704. eCollection 2019. Front Immunol. 2019. PMID: 31402911 Free PMC article. Review.
-
LAT, the linker for activation of T cells: a bridge between T cell-specific and general signaling pathways.Sci STKE. 2000 Dec 19;2000(63):re1. doi: 10.1126/stke.2000.63.re1. Sci STKE. 2000. PMID: 11752630 Review.
Cited by
-
Neutrophils with low production of reactive oxygen species are activated during immune priming and promote development of arthritis.Redox Biol. 2024 Dec;78:103401. doi: 10.1016/j.redox.2024.103401. Epub 2024 Oct 18. Redox Biol. 2024. PMID: 39471640 Free PMC article.
-
The systemic lupus erythematosus-associated NCF190H allele synergizes with viral infection to cause mouse lupus but also limits virus spread.Nat Commun. 2025 Feb 13;16(1):1593. doi: 10.1038/s41467-025-56857-z. Nat Commun. 2025. PMID: 39939342 Free PMC article.
References
-
- Olsson L.M., Johansson Å.C., Gullstrand B., Jönsen A., Saevarsdottir S., Rönnblom L., Leonard D., Wetterö J., Sjöwall C., Svenungsson E., et al. A single nucleotide polymorphism in the NCF1 gene leading to reduced oxidative burst is associated with systemic lupus erythematosus. Ann. Rheum. Dis. 2017;76:1607–1613. doi: 10.1136/annrheumdis-2017-211287. - DOI - PubMed
-
- Yokoyama N., Kawasaki A., Matsushita T., Furukawa H., Kondo Y., Hirano F., Sada K.-E., Matsumoto I., Kusaoi M., Amano H., et al. Association of NCF1 polymorphism with systemic lupus erythematosus and systemic sclerosis but not with ANCA-associated vasculitis in a Japanese population. Sci. Rep. 2019;9:16366. doi: 10.1038/s41598-019-52920-0. - DOI - PMC - PubMed
Grants and funding
LinkOut - more resources
Full Text Sources
Research Materials
Miscellaneous
