. 2024 Apr 17;14(4):389.
doi: 10.3390/brainsci14040389.

A Four-Week High-Fat Diet Induces Anxiolytic-like Behaviors through Mature BDNF in the mPFC of Mice

Affiliations

A Four-Week High-Fat Diet Induces Anxiolytic-like Behaviors through Mature BDNF in the mPFC of Mice

Huixian Huang et al. Brain Sci. .

Abstract

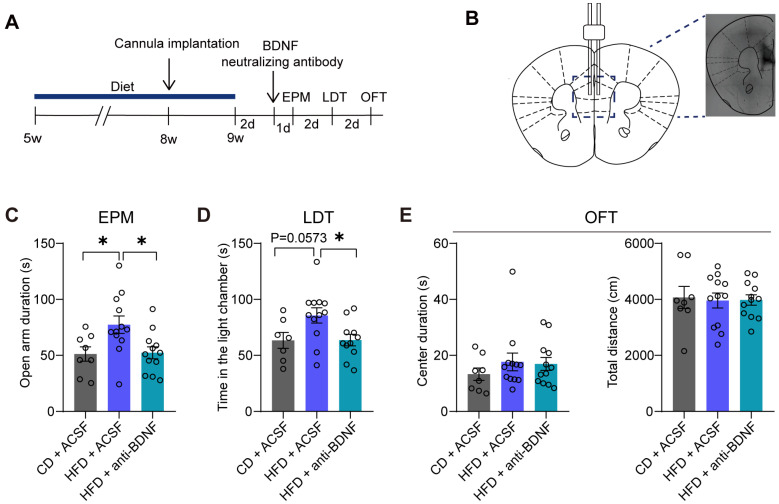
The effect of a high-fat diet (HFD) on mood is a widely debated topic, with the underlying mechanisms being poorly understood. This study explores the anxiolytic effects of a four-week HFD in C57BL/6 mice. Five-week-old mice were exposed to either an HFD (60% calories from fat) or standard chow diet (CD) for four weeks, followed by cannula implantation, virus infusion, behavioral tests, and biochemical assays. Results revealed that four weeks of an HFD induced anxiolytic-like behaviors and increased the protein levels of mature brain-derived neurotrophic factor (mBDNF) and phosphorylated tyrosine kinase receptor B (p-TrkB) in the medial prefrontal cortex (mPFC). Administration of a BDNF-neutralizing antibody to the mPFC reversed HFD-induced anxiolytic-like behaviors. Elevated BDNF levels were observed in both neurons and astrocytes in the mPFC of HFD mice. Additionally, these mice exhibited a higher number of dendritic spines in the mPFC, as well as upregulation of postsynaptic density protein 95 (PSD95). Furthermore, mRNA levels of the N6-methyladenosine (m6A) demethylase, fat mass and obesity-associated protein (FTO), and the hydrolase matrix metalloproteinase-9 (MMP9), also increased in the mPFC. These findings suggest that an HFD may induce FTO and MMP9, which could potentially regulate BDNF processing, contributing to anxiolytic-like behaviors. This study proposes potential molecular mechanisms that may underlie HFD-induced anxiolytic behaviors.

Keywords: BDNF; anxiolytic-like behaviors; dendritic spine; high-fat diet; mPFC.


Conflict of interest statement

The authors declare no conflicts of interest.

Figures

Figure 1
Figure 1
Mice fed an HFD for four weeks exhibit anxiolytic-like behaviors. (A) Schematic of diet processing and behavioral test paradigms. (B) Cumulative body weight curves of mice fed a standard chow diet (CD) and high-fat diet (HFD) (two-way repeated measures ANOVA followed by Bonferroni’s multiple comparisons test, time: F(1, 20) = 5.095, p = 0.0353; weight: F(5, 100) = 58.08, p < 0.0001; n = 11 mice per group). (C) Time spent exploring the open arms (left), entries into the two open arms (right) in the elevated plus maze test (EPM) (two-tailed Student’s t-test, duration: t = 3.071, p = 0.0073; entries: t = 2.796, p = 0.0130; n = nine mice per group). (D) Time spent in the light chamber in the light-dark box test (LDT) (two-tailed Student’s t-test, t = 2.210, p = 0.0430; CD: n = eight mice; HFD: n = nine mice). (E) Time spent in the center zone (center duration) during the first 5 min (left) and total distance explored during the 30 min (right) in the open field test (OFT) (two-tailed Student’s t-test, duration: t = 0.3616, p = 0.7224; distance: t = 1.341, p = 0.1987; n = nine mice per group). All data are presented as the mean ± SEM. * p < 0.05; ** p < 0.01.
Figure 2
Figure 2
mBDNF and p-TrkB levels in the mPFC are increased in HFD mice. (A) Western blotting images (left) and quantification (right) of pro-protein of brain-derived neurotrophic factor (proBDNF) and mature brain-derived neurotrophic factor (mBDNF) in the medial prefrontal cortex (mPFC) (two-tailed Student’s t-test; proBDNF: t = 0.5867, p = 0.5788; mBDNF: t = 3.203, p = 0.0185; n = four mice per group). (B) Western blotting images (left) and quantification (right) of proBDNF and mBDNF in the amygdala (two-tailed Student’s t-test, proBDNF: t = 0.1815, p = 0.8619; mBDNF: t = 0.6283, p = 0.5530; n = four mice per group). (C) Western blotting images (left) and quantification (right) of proBDNF and mBDNF in the hippocampus (two-tailed Student’s t-test, proBDNF: t = 3.104, p = 0.0210; mBDNF: t = 0.2934, p = 0.7791; n = four mice per group). (D) Western blotting image (left) and quantification (right) of phosphorylated tyrosine kinase receptor B (p-TrkB) and tyrosine kinase receptor B (TrkB) in the mPFC (two-tailed Student’s t-test, p-TrkB: t = 3.104, p = 0.0210; TrkB: t = 0.8412, p = 0.4325; n = four mice per group). All data are presented as the mean ± SEM. * p < 0.05.
Figure 3
Figure 3
The administration of a BDNF-neutralizing antibody into the mPFC reverses anxiolytic-like behaviors induced by the HFD. (A) Schematic of surgical processing and behavioral test paradigms. (B) Representative images of the injection site in the medial prefrontal cortex (mPFC) of trypan blue. (C) Time spent exploring the open arms in the elevated plus maze test (EPM) (one-way ANOVA, F(2, 29) = 5.060, p = 0.0130; CD + ACSF: n = eight mice; HFD + ACSF: n = 12 mice; HFD + anti-BDNF: n = 12 mice). (D) Time spent in the light chamber in the light-dark box test (LDT) (one-way ANOVA, F(2, 27) = 4.292, p = 0.0241; CD + ACSF: n = seven mice; HFD + ACSF: n = 12 mice; HFD + anti-BDNF: n = 11 mice). (E) Time spent in the center zone (center duration) during the first 5 min (one-way ANOVA, F(2, 29) = 0.6306, p = 0.5394; CD + ACSF: n = eight mice; HFD + ACSF: n = 12 mice; HFD + anti-BDNF: n = 12 mice) (left) and total distance explored during the 30 min (right) in the open field test (OFT) (one-way ANOVA, F(2, 29) = 0.03793, p = 0.9628; CD + ACSF: n = eight mice; HFD + ACSF: n = 12 mice; HFD + anti-BDNF: n = 12 mice). All data are presented as the mean ± SEM. * p < 0.05.
Figure 4
Figure 4
BDNF levels are increased in both neurons and astrocytes in the mPFC of mice fed an HFD. (A) Representative immunofluorescence staining (left) and quantification (right) of brain-derived neurotrophic factor (BDNF) (green) in NeuN+ cells (red) in the medial prefrontal cortex (mPFC) (two-tailed Student’s t-test, t = 2.939, p = 0.0323; CD: n = four mice; HFD: n = three mice; 80–100 cells per mice were observed). Scale bar = 10 μm (left), 25 μm (right). (B) Representative immunofluorescence staining (left) and quantification (right) of BDNF (green) in S100β+ cells (red) in the mPFC (two-tailed Student’s t-test, t = 2.731, p = 0.0412; CD: n = four mice; HFD: n = three mice; 30–50 cells per mice were observed). Scale bar = 10 μm (left), 25 μm (right). The arrows indicate co-labeled cells. All data are presented as the mean ± SEM. * p < 0.05.
Figure 5
Figure 5
A four-week HFD promotes the expression of PSD95 and increases the density of dendritic spines. (A) Western blotting images (left) and quantification (right) of postsynaptic density protein 95 (PSD95) in the medial prefrontal cortex (mPFC) (two-tailed Student’s t-test, t = 3.935, p = 0.007; n = four mice per group). (B) Representative confocal imaging (left) and quantification (right) of dendritic spines of pyramidal neurons in the mPFC (two-tailed Student’s t-test, t = 2.625, p = 0.0254; n = six cells for three mice). Scale bar = 5 µm. All data are presented as the mean ± SEM. * p < 0.05; ** p < 0.01.
Figure 6
Figure 6
FTO and MMP9 levels in the mPFC are increased in HFD mice. (A) Relative mRNA levels of methyltransferase-like 3 (Mettl3), fat mass and obesity-associated protein (FTO), a-ketoglutarate-dependent dioxygenase alkB homolog 5 (Alkbh5), YTH domain-containing family protein 1 (Ythdf1), and YTH domain-containing family protein 2 (Ythdf2) in the mPFC (two-tailed Student’s t-test, Mettl3: t = 0.004694, p = 0.9963; FTO: t = 2.440, p = 0.0311; Alkbh5: t = 1.147, p = 0.2738; Ythdf1: t = 0.4234, p = 0.6795; Ythdf2: t = 0.1209, p = 0.9057; n = seven mice per group). (B) Relative levels of matrix metalloproteinase-9 (MMP9) mRNA in the mPFC (two-tailed Student’s t-test, t = 2.698, p = 0.0194; n = seven mice per group). All data are presented as the mean ± SEM. * p < 0.05.

Similar articles

Cited by

References

    1. Pan W., Zhao J., Wu J., Xu D., Meng X., Jiang P., Shi H., Ge X., Yang X., Hu M., et al. Dimethyl itaconate ameliorates cognitive impairment induced by a high-fat diet via the gut-brain axis in mice. Microbiome. 2023;11:30. doi: 10.1186/s40168-023-01471-8. - DOI - PMC - PubMed
    1. Chrobok L., Klich J.D., Sanetra A.M., Jeczmien-Lazur J.S., Pradel K., Palus-Chramiec K., Kepczynski M., Piggins H.D., Lewandowski M.H. Rhythmic neuronal activities of the rat nucleus of the solitary tract are impaired by high-fat diet-implications for daily control of satiety. J. Physiol. Lond. 2022;600:751–767. doi: 10.1113/JP281838. - DOI - PubMed
    1. Vagena E., Ryu J.K., Baeza-Raja B., Walsh N.M., Syme C., Day J.P., Houslay M.D., Baillie G.S. A high-fat diet promotes depression-like behavior in mice by suppressing hypothalamic PKA signaling. Transl. Psychiatry. 2019;9:141. doi: 10.1038/s41398-019-0470-1. - DOI - PMC - PubMed
    1. de Noronha S.R., Campos G.V., Abreu A.R., de Souza A.A., Chianca D.J., de Menezes R.C. High fat diet induced-obesity facilitates anxiety-like behaviors due to GABAergic impairment within the dorsomedial hypothalamus in rats. Behav. Brain Res. 2017;316:38–46. doi: 10.1016/j.bbr.2016.08.042. - DOI - PubMed
    1. Dutheil S., Ota K.T., Wohleb E.S., Rasmussen K., Duman R.S. High-Fat Diet Induced Anxiety and Anhedonia: Impact on Brain Homeostasis and Inflammation. Neuropsychopharmacology. 2016;41:1874–1887. doi: 10.1038/npp.2015.357. - DOI - PMC - PubMed

LinkOut - more resources