. 2024 Mar 25;12(4):730.
doi: 10.3390/biomedicines12040730.

Apoptotic Vesicles Derived from Dental Pulp Stem Cells Promote Bone Formation through the ERK1/2 Signaling Pathway

Affiliations

Apoptotic Vesicles Derived from Dental Pulp Stem Cells Promote Bone Formation through the ERK1/2 Signaling Pathway

Kunkun Yang et al. Biomedicines. .

Abstract

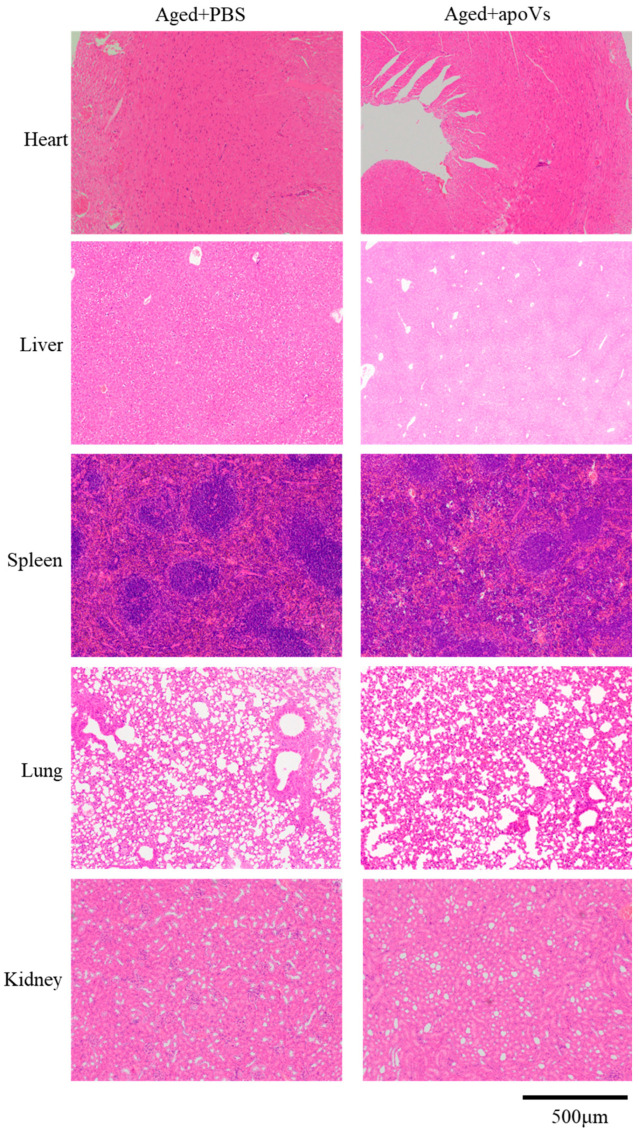
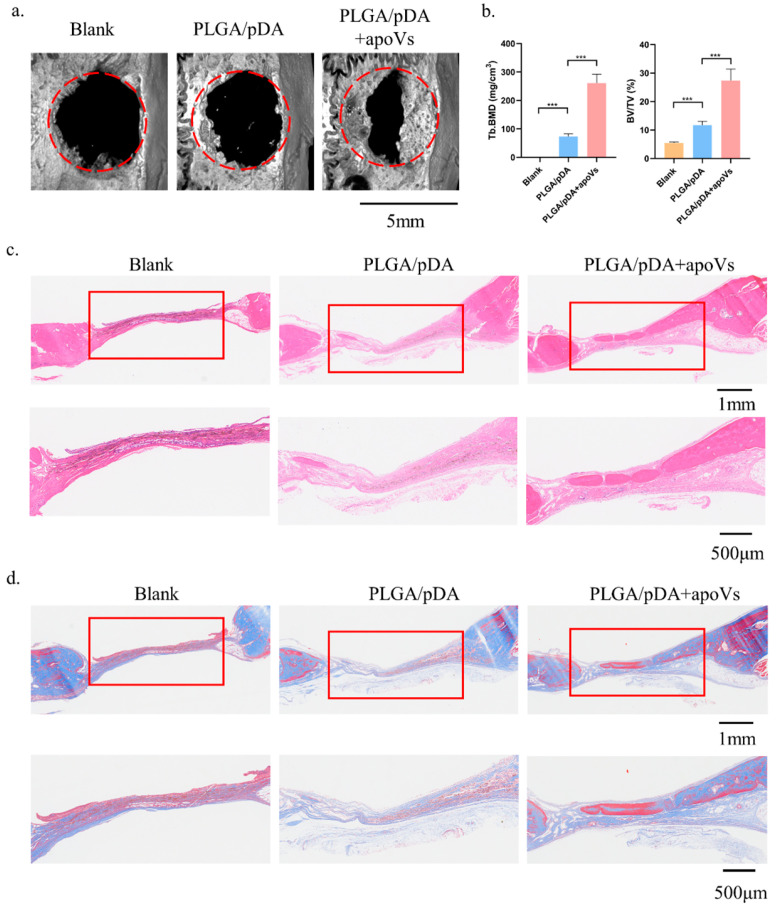
Osteoporosis is a common degenerative bone disease. The treatment of osteoporosis remains a clinical challenge in light of the increasing aging population. Human dental pulp stem cells (DPSCs), a type of mesenchymal stem cells (MSCs), are easy to obtain and have a high proliferation ability, playing an important role in the treatment of osteoporosis. However, MSCs undergo apoptosis within a short time when used in vivo; therefore, apoptotic vesicles (apoVs) have attracted increasing attention. Currently, the osteogenic effect of DPSC-derived apoVs is unknown; therefore, this study aimed to determine the role of DPSC-derived apoVs and their potential mechanisms in bone regeneration. We found that MSCs could take up DPSC-derived apoVs, which then promoted MSC osteogenesis in vitro. Moreover, apoVs could increase the trabecular bone count and bone mineral density in the mouse osteoporosis model and could promote bone formation in rat cranial defects in vivo. Mechanistically, apoVs promoted MSC osteogenesis by activating the extracellular regulated kinase (ERK)1/2 signaling pathway. Consequently, we propose a novel therapy comprising DPSC-derived apoVs, representing a promising approach to treat bone loss and bone defects.

Keywords: ERK1/2 signaling pathway; apoptotic vesicles; bone defect; dental pulp stem cells; osteogenic differentiation; osteoporosis.


Conflict of interest statement

The authors declare no conflicts of interest.

Figures

Figure A1
Figure A1
Growth curve measured using the Cell Counting Kit-8 (CCK-8) assay; apoVs at 1.0 μg/mL and 1.4 μg/mL inhibited the cell proliferation of MSCs from day 4 to day 7. * p < 0.05; ** p < 0.01; *** p < 0.001. ## p < 0.01; ### p < 0.001.
Figure A2
Figure A2
(a) ApoVs at 0.2, 0.4, and 0.6 μg/mL accelerated mineralization in MSCs, as indicated by ALP staining. ApoVs at 0.4 μg/mL showed the most gray-black massive and strip-shaped precipitation. (b) ApoVs at 0.2, 0.4, and 0.6 μg/mL accelerated mineralization in MSCs, as indicated by ARS staining. ApoVs at 0.4 μg/mL had the most mineralized nodule formation.
Figure A3
Figure A3
Reprehensive time-dependent in vivo fluorescence images of apoVs with DiIC18(7) (1,1′-Dioctadecyl-3,3,3′,3′-Tetramethylindotricarbocyanine Iodide (DiR) dyes in mice. The signals were collected in the 780 nm channel with laser excitation at 750 nm.
Figure A4
Figure A4
ApoVs caused no toxicity or inflammation in the viscera of the OVX mice. Tail vein injection of apoVs for 8 weeks did not cause toxicity or inflammation changes in the kidney, liver, spleen, lung, or heart of mice. Scale bar = 500 μm.
Figure A5
Figure A5
ApoVs caused no toxicity or inflammation in the viscera of the aged mice. Tail vein injection of apoVs for 8 weeks did not cause toxicity or inflammation changes in the kidney, liver, spleen, lung, or heart of mice. Scale bar = 500 μm.
Figure A6
Figure A6
(a) Scanning electron microscopy of PLGA scaffolds (PLGA), PLGA scaffolds coated with poly-dopamine coating (PLGA/pDA) and PLGA scaffolds coated with poly-dopamine and apoVs (PLGA/pDA + apoVs). (b) Distribution of PKH-26 labeled apoVs on the PLGA/pDA scaffold, with PKH-26-stained PLGA scaffold as control.
Figure A7
Figure A7
The alterations in MSC signaling pathways following the addition of apoVs. MSCs were treated with PM, OM, and OM + apoVs for 7 days. (a) Western blotting of the protein levels of phosphorylated (p)-SMAD1/5, SMAD1, SMAD5, and GAPDH. (b). Western blotting of protein expression of p-STAT3, STAT3, and α-tubulin. (c) Western blotting of protein expression of p-AKT, AKT and GAPDH. SMAD1, SMAD family member 1; SMAD5, SMAD family member 5; STAT3, signal transducer and activator of transcription 3; AKT, protein kinase B.
Figure A8
Figure A8
ApoVs and KO-947 caused no toxicity or inflammation in the viscera of the OVX mice. Tail vein injection of apoVs for 8 weeks did not cause toxicity or inflammation changes in the kidney, liver, spleen, lung, or heart of mice. Scale bar = 500 μm.
Figure 1
Figure 1
Characterization of DPSC-derived apoVs. (a) Schematic diagram indicating the procedures to isolate apoVs. (b) TUNEL staining results in the different groups. TUNEL positive stained cells are red. (c) Morphology of apoVs according to TEM analysis. (d) The size distribution and potential of the apoVs measured using nanoparticle tracking analysis. (e) Western blotting analysis of the DPSCs and DPSC-derived apoVs. STS, staurosporine; TEM, transmission electron microscopy; DPSC, dental pulp stem cell; apoVs, apoptotic vesicles; TUNEL, TdT-mediated dUTP nick end labeling; MSC, mesenchymal stem cell; DAPI, 4′,6-diamidino-2-phenylindole; CD36, CD36 molecule; TSG101, tumor susceptibility 101; CD81, CD81 molecule; GAPDH, glyceraldehyde-3-phosphate dehydrogenase.
Figure 2
Figure 2
MSCs were incubated with PKH-26-labeled apoVs (red) for 4 h, 8 h, and 12 h, respectively. The nuclei of MSCs were stained with DAPI (blue). The F-actin of MSCs was stained with phalloidin (green). DAPI, 6-diamidine-2-phenylindole; MSCs, mesenchymal stem cells.
Figure 3
Figure 3
DPSC-derived apoVs enhanced the osteogenic differentiation of MSCs in vitro. (a) ApoVs increased ALP staining (left) and activity (right) on the seventh day after the osteogenic induction of MSCs. (b) ApoVs promoted ARS staining (left) and quantification (right) on the 14th day after the osteogenic induction of MSCs. (c) ApoVs promoted the mRNA expression of ALP, RUNX2, OCN, and COL 1A1 detected by RT-qPCR. (d) The neo-generated tissues were characterized by H&E staining. (e) Masson staining of histological sections. All data are shown as the mean ± SD. * p < 0.05, ** p < 0.01 and *** p < 0.001. ALP, alkaline phosphatase; ARS, alizarin red S; OM, osteogenic media; PM, proliferation media; H&E, haematoxylin-eosin; β-TCP, β-tricalcium phosphate; RUNX2, runt-related transcription factor 2; OCN, osteocalcin; COL1A1, collagen type I alpha 1 chain; qRT-PCR, quantitative real-time reverse transcription PCR.
Figure 4
Figure 4
ApoVs attenuated the bone loss induced by estrogen deficiency in OVX mice. (a) The osteoporosis mouse models were established by removing both ovaries, followed by tail vein injection of apoVs once a week for 8 weeks. (b) Micro-CT images of femurs in the SHAM mice with PBS treatment, OVX mice with PBS treatment, and OVX mice with apoVs treatment. (c) Quantitative measurements of BV/TV, Tb. N, Tb. Sp, Tb. Th, BS/BV, and BMD of the SHAM and OVX groups. (d) H&E staining. (e) Masson staining. (f) Representative images of new bone formation in the distal femoral epiphysis, assessed using double-labeling with calcein and alizarin-3-methyliminodiacetic acid. Dynamic MAR measured from the femur. All data shown are the mean ± SD. * p < 0.05, ** p < 0.01, and *** p < 0.001. MAR, mineral apposition rate; OVX, ovariectomized; micro-CT, Inveon micro-computed tomography; the Inveon Research Workplace 4.2 software, a three-dimensional reconstruction and parametric analysis; PBS, phosphate-buffered saline; BV/TV, bone volume/total volume; Tb. N, trabecular number; Tb. Sp, trabecular separation; Tb. Th, trabecular thickness; BS/BV, bone surface area/bone volume; BMD, bone mineral density.
Figure 5
Figure 5
ApoVs partially reversed bone loss in aged mice. (a) Micro-CT images of femurs in aged mice treated with PBS and treated with apoVs for 8 weeks. (b) Quantitative measurements of BV/TV, Tb. N, Tb. Sp, Tb. Th, BS/BV, and BMD of aged groups. (c) H&E staining. (d) Masson staining. (e) Representative images of new bone formation in the distal femoral epiphysis assessed by double-labeling with calcein and alizarin-3-methyliminodiacetic acid. Dynamic MAR measured from the femur. All data shown are the mean ± SD. * p < 0.05, ** p < 0.01 and *** p < 0.001.
Figure 6
Figure 6
ApoVs increased bone formation in critical-sized rat calvarial defects. Rats were treated with PLGA scaffolds (PLGA), PLGA scaffolds with poly-dopamine coating (PLGA/pDA) or PLGA scaffolds coated with poly-dopamine and apoVs (PLGA/pDA + apoVs). (a) Micro-CT images of bone formation in each group after 6 weeks. (b) Quantitative comparison of new bone volume among the different groups. *** p < 0.001 compared with groups without apoVs. Histological assessment of bone formation in each group: (c) H&E staining. (d) Masson staining. PLGA, poly (lactic-co-glycolic acid); PLGA/pDA, PLGA scaffolds coated with polydopamine; micro-CT, Inveon micro-computed tomography; the Inveon Research Workplace 4.2 software, a three-dimensional reconstruction and parametric analysis.
Figure 7
Figure 7
ApoVs regulated the osteogenic differentiation of MSCs via the ERK1/2 signaling pathway. (a) Western blotting of the protein expression of p-ERK, ERK, RUNX 2, and GAPDH. MSCs were treated with PM, OM, and OM + apoVs for 7 days. (b) Western blotting of the protein expression of p-ERK, ERK, RUNX 2, and GAPDH. MSCs were treated with PM, OM, OM + apoVs, OM + KO-947, and OM + KO-947 + apoVs for 7 days. ALP staining (c) and ARS staining (d) in the PM, OM, OM + apoVs, OM + KO-947, and OM + KO-947 + apoVs groups. KO-947, ERK1/2 signaling pathway inhibitor.
Figure 8
Figure 8
ApoVs can partially restore the effect of the ERK1/2 pathway inhibitor on bone loss in OVX mice. (a) Micro-CT images of femurs among the SHAM, OVX + PBS, OVX + apoVs, OVX + KO-947, and OVX + apoVs + KO-947 groups. (b) Bone morphometry analysis among these groups. Mouse bone marrow mesenchymal stem cells (mBMMSCs) extracted from mouse femurs from the different groups were stained (c) with ALP on day 7 and (d) with ARS on day 14. ns, no significance; * p < 0.05; ** p < 0.01; *** p < 0.001.

Similar articles

Cited by

References

    1. Delaisse J.M., Andersen T.L., Kristensen H.B., Jensen P.R., Andreasen C.M., Søe K. Re-thinking the bone remodeling cycle mechanism and the origin of bone loss. Bone. 2020;141:115628. doi: 10.1016/j.bone.2020.115628. - DOI - PubMed
    1. Lee N.K., Sowa H., Hinoi E., Ferron M., Ahn J.D., Confavreux C., Dacquin R., Mee P.J., McKee M.D., Jung D.Y., et al. Endocrine regulation of energy metabolism by the skeleton. Cell. 2007;130:456–469. doi: 10.1016/j.cell.2007.05.047. - DOI - PMC - PubMed
    1. Zhao P., Xiao L., Peng J., Peng J., Qian Y.Q., Huang C.C. Exosomes derived from bone marrow mesenchymal stem cells improve osteoporosis through promoting osteoblast proliferation via MAPK pathway. Eur. Rev. Med. Pharmacol. Sci. 2018;22:3962–3970. - PubMed
    1. Jiang H.T., Ran C.C., Liao Y.P., Zhu J.H., Wang H., Deng R., Nie M., He B.C., Deng Z.L. IGF-1 reverses the osteogenic inhibitory effect of dexamethasone on BMP9-induced osteogenic differentiation in mouse embryonic fibroblasts via PI3K/AKT/COX-2 pathway. J. Steroid Biochem. Mol. Biol. 2019;191:105363. doi: 10.1016/j.jsbmb.2019.04.012. - DOI - PubMed
    1. Wang C., Liu Y., Hu X., Shang X., Ma S., Guo H., Ma X., Cai D., Hu Z., Zhao Y., et al. Titanium dioxide nanotubes increase purinergic receptor P2Y6 expression and activate its downstream PKCα-ERK1/2 pathway in bone marrow mesenchymal stem cells under osteogenic induction. Acta Biomater. 2023;157:670–682. doi: 10.1016/j.actbio.2022.11.045. - DOI - PubMed

LinkOut - more resources