. 2024 Mar 27;12(4):744.
doi: 10.3390/biomedicines12040744.

Detection of ER Stress in iPSC-Derived Neurons Carrying the p.N370S Mutation in the GBA1 Gene

Affiliations

Detection of ER Stress in iPSC-Derived Neurons Carrying the p.N370S Mutation in the GBA1 Gene

Elena S Yarkova et al. Biomedicines. .

Abstract

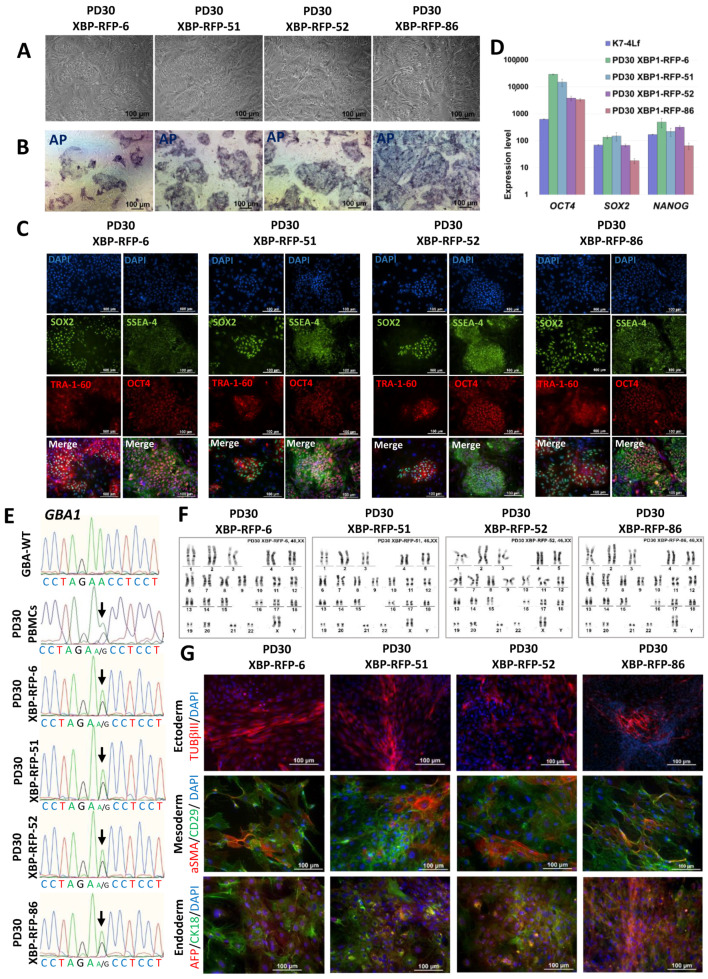
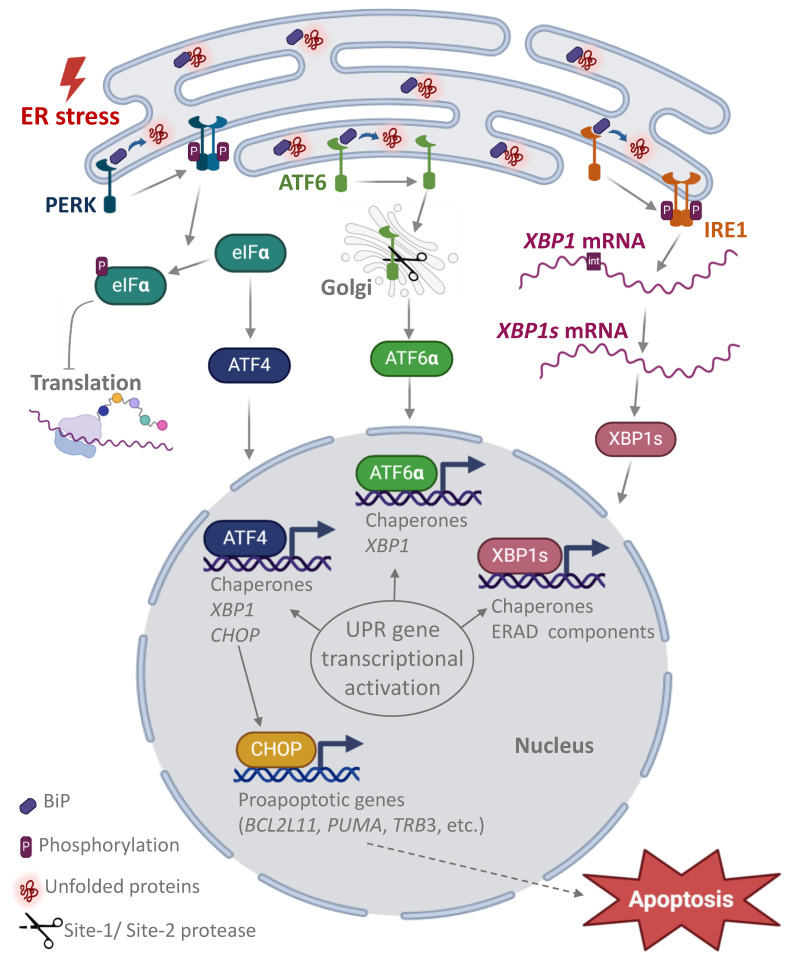
Endoplasmic reticulum (ER) stress is involved in the pathogenesis of many human diseases, such as cancer, type 2 diabetes, kidney disease, atherosclerosis and neurodegenerative diseases, in particular Parkinson's disease (PD). Since there is currently no treatment for PD, a better understanding of the molecular mechanisms underlying its pathogenesis, including the mechanisms of the switch from adaptation in the form of unfolded protein response (UPR) to apoptosis under ER stress conditions, may help in the search for treatment methods. Genetically encoded biosensors based on fluorescent proteins are suitable tools that facilitate the study of living cells and visualization of molecular events in real time. The combination of technologies to generate patient-specific iPSC lines and genetically encoded biosensors allows the creation of cell models with new properties. Using CRISPR-Cas9-mediated homologous recombination at the AAVS1 locus of iPSC with the genetic variant p.N370S (rs76763715) in the GBA1 gene, we created a cell model designed to study the activation conditions of the IRE1-XBP1 cascade of the UPR system. The cell lines obtained have a doxycycline-dependent expression of the genetically encoded biosensor XBP1-TagRFP, possess all the properties of human pluripotent cells, and can be used to test physical conditions and chemical compounds that affect the development of ER stress, the functioning of the UPR system, and in particular, the IRE1-XBP1 cascade.

Keywords: CRISPR/Cas9; ER stress; GBA1; Parkinson’s disease; biosensors; endoplasmic reticulum; induced pluripotent stem cells.


Conflict of interest statement

The authors declare no conflicts of interests.

Figures

Figure 1
Figure 1
Characterization of the iPSC cell lines K7-2Lf, PD30-1 and PD30-3. (A) Cells exhibit typical iPSC morphology. (B) iPSC colonies are positively stained for alkaline phosphatase (AP). (C) Immunofluorescence analysis revealed expression of the pluripotency markers OCT4 (red signal), SOX2 (green signal), SSEA-4 (green signal), TRA-1-60 (red signal). (D) Quantitative analysis of NANOG, OCT4 and SOX2 expression was performed by RT-qPCR. Error bars indicate the standard deviation. (E) Chromosome analysis demonstrated a normal karyotype (46,XX) for all three cell lines. (F) Immunofluorescence staining for differentiation markers in spontaneously differentiated cell cultures of K7-2Lf, PD30-1, and PD30-3 revealed derivatives of the three germ layers: mesoderm—αSMA (red signal); ectoderm—TUBB3 (red signal) and NF200 (green signal); and endoderm—FOXA2 (red signal) and AFP (green signal). Nuclei are stained with DAPI (blue signal). (G) Sequenograms of GBA1 gene regions from PBMCs of a patient with Parkinson’s disease, and a healthy donor (control, GBA-WT). The detected polymorphic position is indicated by arrows. All scale bars: 100 μm.
Figure 2
Figure 2
Characteristics of neural derivatives at days 55–60 of differentiation. (A) Immunofluorescence staining for markers of midbrain precursors OTX2 (red signal); a specific markers of DA neurons: tyrosine hydroxylase (TH, green signal) and LMX1A (red signal); and a common neural marker TUBβIII (green signal). Nuclei are stained with DAPI (blue signal). Scale bar: 100 µm. (B) Normalized expression level of dopaminergic neuron markers (TH, LMX1A, OTX2 and SOX6) in neural derivatives (n = 4). (C) Correlation between GBA1 (purple bars) and TH (green bars) expression level in neural derivatives.
Figure 3
Figure 3
ER stress detection by evaluating the expression of CHOP and XBP1 genes involved in UPR activation in iPSC-derived DA neurons and in iPSCs with and without tunicamycin treatment. (A) PCR analysis for the spliced form of XBP1 (XBP1s, shown by arrow) in the iPSC-ctrl line after treatment with ER stress inducer tunicamycin (iPSCs +Tun). The spliced form of XBP1 is absent in iPSC-ctrl without tunicamycin (iPSCs –Tun) and in neural derivatives derived from iPSC-GBA (DA PD30-1, DA PD30-3, DA PD30-4-7, DA PD31-6, DA PD31-7, DA PD31-15) and iPSC-ctrl (DA K6-4f, DA K7-4Lf, DA K7-2Lf) on days 55–60 of differentiation. (B) Detection of the XBP1s using qPCR. n = 9 for DA neurons. n = 3 for iPSC. (C) The expression level of the CHOP gene in DA-neurons and iPSCs +/−Tun estimated by qPCR. DA GBA—neurons obtained from iPSC-GBA, DA ctrl—DA -neurons obtained from iPSCs from healthy patients.
Figure 4
Figure 4
PCR assay for the integration of the XBP1-TagRFP biosensor and its doxycycline-dependent transactivator into the AAVS1 locus. XBP1_HAL—screening for the integration of the XBP1-TagRFP biosensor into the AAVS1 locus, M2rtTA_HAL—screening for the integration of the M2rtTA transgene with a transactivator into the AAVS1 locus, XBP1_M13—screening for the presence of a non-target pXBP1-TagRFP-ERSS plasmid incorporating into the genome, M2rtTA_M13—screening for the presence of a non-target AAVS1-Neo-M2rtTA plasmid incorporating into the genome, AAVS_WT screening against the wild type of the AAVS1 locus.
Figure 5
Figure 5
Characterization of the iPSC lines PD30-XBP-RFP-6, PD30-XBP-RFP-51, PD30-XBP-RFP-52 and PD30-XBP-RFP-86. (A) Typical morphology of iPSC colonies. (B) Cells demonstrate AP activity. (C) Immunofluorescence staining reveals expression of the pluripotency markers OCT4 (red signal), SOX2 (green signal), SSEA-4 (green signal), TRA-1-60 (red signal). (D) Results of RT-qPCR analysis of the expression of pluripotency genes (NANOG, OCT4, SOX2) normalized to B2M. Error bars indicate standard deviation. (E) Sequenograms of GBA1 gene regions from PBMCs of a patient with Parkinson’s disease, transgenic iPSC lines, and a healthy donor (control, GBA-WT). The detected polymorphisms are marked with arrows. (F) Karyotype analysis shows a normal chromosome set (46,XX) in all four iPSC lines. (G) Immunofluorescence staining for differentiation markers in spontaneously differentiated cell cultures PD30-XBP-RFP-6, PD30-XBP-RFP-51, PD30-XBP-RFP-52 and PD30-XBP-RFP-86 revealed derivatives of the three germ layers: mesoderm—αSMA (red signal) and CD29 (green signal); ectoderm—TUBB3/TUJ1 (red signal); endoderm—cytokeratin 18 (CK18) (green signal) and AFP (red signal). Nuclei are stained with DAPI (blue signal). All scale bars: 100 μm.
Figure 6
Figure 6
The scheme of operation of the ER stress biosensor XBP1-TagRFP. Under ER stress, the IRE1 protein is activated, forms a dimer, and begins to splice XBP1-TagRFP mRNA, i.e., to excise an intron of 26 base pairs (shown in gray), resulting in a frameshift and translation of the fluorescent TagRFP protein. A red fluorescent signal appears in transgenic cells, indicating activation of the UPR system. In the absence of ER stress, the chimeric mRNA XBP1-TagRFP is not spliced and translation of the sensory protein is terminated by the stop codon located after the intron. Thus, TagRFP synthesis is only provided from a spliced transcript.
Figure 7
Figure 7
Operation of the ER stress biosensor in transgenic iPSC-GBA lines with integration of the XBP1-TagRFP biosensor. (A) Absence of TagRFP immunofluorescence signal in iPSCs without tunicamycin treatment. (B) Immunofluorescence lifetime glow of TagRFP in transgenic iPSCs after addition of tunicamycin. BF—bright field. All scale bars—100 μm.
Figure 8
Figure 8
UPR systems activation under ER stress. The three major pathways of the UPR signaling cascade are determined by the key transmembrane proteins inositol-requiring protein 1α (IRE1α), activating transcription factor 6 (ATF6), and the protein kinase RNA-like ER kinase (PERK). In the absence of stress, the transmembrane proteins IRE1a, ATF6 and PERK are associated with the chaperone-binding immunoglobulin (BiP), also known as the 78 kDa glucose regulatory protein (GRP78), in the lumen of the ER. In the presence of stress, BiP is released by binding to misfolded proteins, IRE1a and PERK proteins form homodimers, autophosphorylates and exit the ER. At the same time, phosphorylated IRE1a acquires ribonucleic acid endonuclease activity, cutting a 26-nucleotide intron from XBP1 mRNA, resulting in the translation of the spliced form XBP1 (XBP1s), a transcription factor that activates UPR chaperone response genes (including BiP) and ER components that contribute to peptide folding, ER lipid synthesis, and ER stress reduction. Under chronic ER stress, XBP1s induces an ER-related degradation (READ) pathway. Activated PERK phosphorylates the translation initiation factor eIF2α, inhibiting mRNA translation and protein synthesis, but activating transcription factor 4 (ATF4). ATF4 regulates the expression of chaperone genes and XBP1. Late in the development of the UPR response, ATF4 activates transcription of the master gene CHOP, which regulates the pro-apoptotic cascade of events. In the presence of ER stress, the ATP6 protein translocates to the Golgi apparatus, where the C-terminus of the protein is cleaved to form activated ATP6a, which enters the nucleus and activates the chaperone and XBP1 genes [1,2,39,40,41].

Similar articles

Cited by

References

    1. Hetz C., Zhang K., Kaufman R.J. Mechanisms, regulation and functions of the unfolded protein response. Nat. Rev. Mol. Cell Biol. 2020;21:421–438. doi: 10.1038/s41580-020-0250-z. - DOI - PMC - PubMed
    1. Frakes A.E., Dillin A. The UPRER: Sensor and Coordinator of Organismal Homeostasis. Mol. Cell. 2017;66:761–771. doi: 10.1016/j.molcel.2017.05.031. - DOI - PubMed
    1. Oslowski C.M., Urano F. Measuring ER stress and the unfolded protein response using mammalian tissue culture system. Methods Enzymol. 2011;490:71–92. doi: 10.1016/B978-0-12-385114-7.00004-0. - DOI - PMC - PubMed
    1. Kennedy D., Samali A., Jäger R. Methods for studying ER stress and UPR markers in human cells. Methods Mol. Biol. 2015;1292:3–18. doi: 10.1007/978-1-4939-2522-3_1. - DOI - PubMed
    1. Subach O.M., Kunitsyna T.A., Mineyeva O.A., Lazutkin A.A., Bezryadnov D.V., Barykina N.V., Piatkevich K.D., Ermakova Y.G., Bilan D.S., Belousov V.V., et al. Slowly reducible genetically encoded green fluorescent indicator for in vivo and ex vivo visualization of hydrogen peroxide. Int. J. Mol. Sci. 2019;20:3138. doi: 10.3390/ijms20133138. - DOI - PMC - PubMed

LinkOut - more resources