

Possible Causal Association between Type 2 Diabetes and Glycaemic Traits in Primary Open-Angle Glaucoma: A Two-Sample Mendelian Randomisation Study
- PMID: 38672220
- PMCID: PMC11048047
- DOI: 10.3390/biomedicines12040866
Possible Causal Association between Type 2 Diabetes and Glycaemic Traits in Primary Open-Angle Glaucoma: A Two-Sample Mendelian Randomisation Study
Abstract
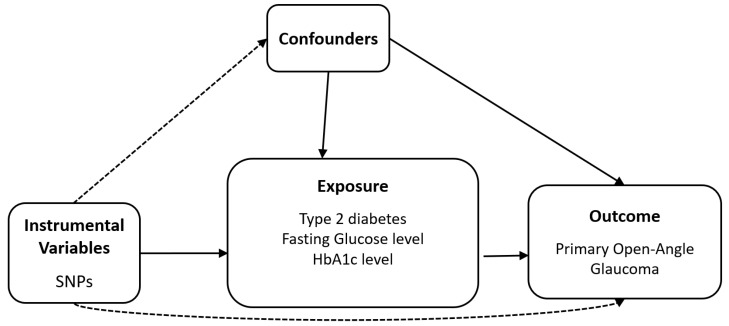
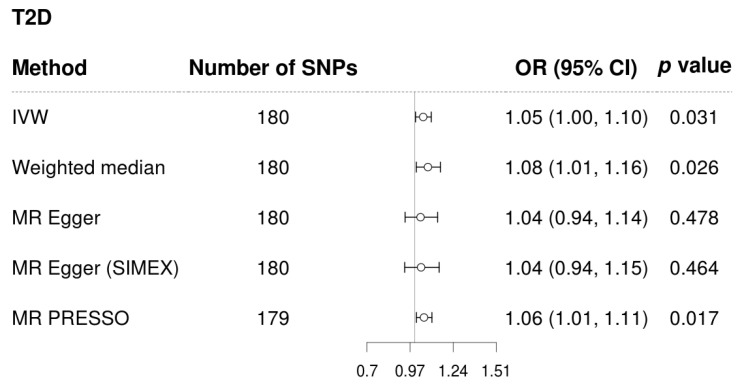
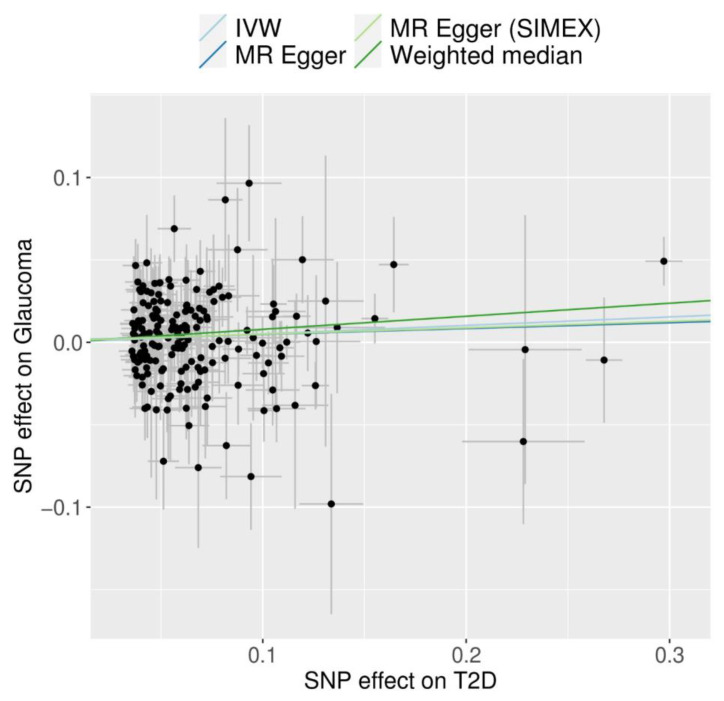
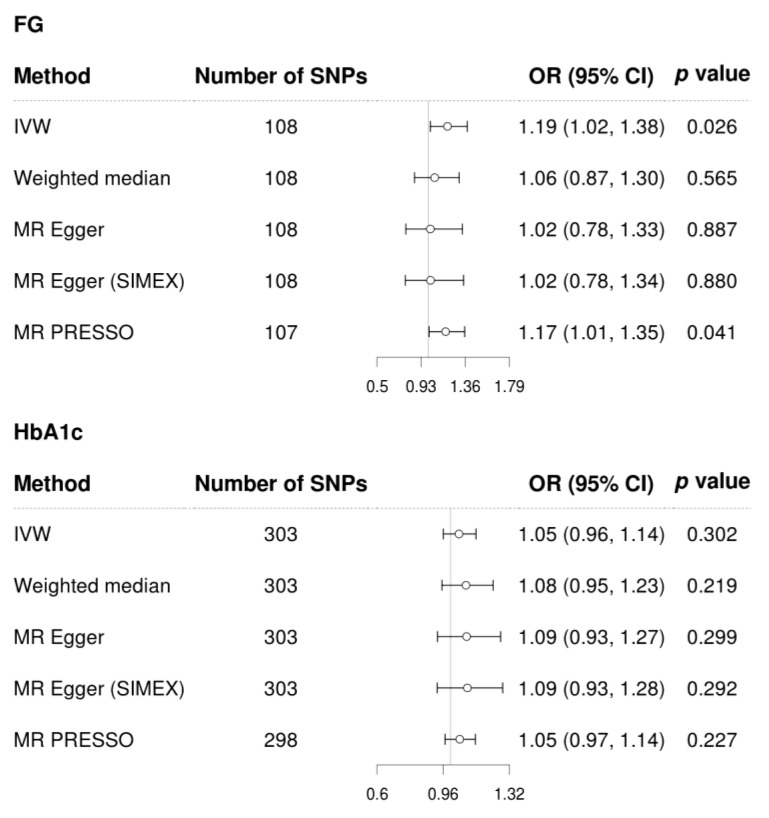
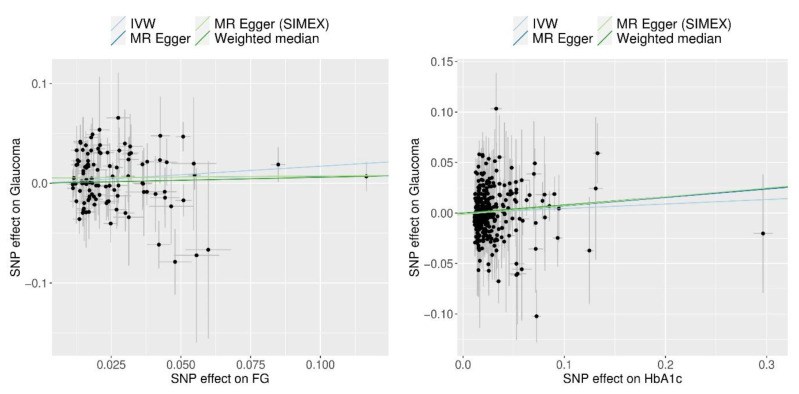
Existing literature suggests a controversial relationship between type 2 diabetes mellitus (T2D) and glaucoma. This study aimed to examine the potential causal connection between T2D and glycaemic traits (fasting glucose [FG] and glycated haemoglobin [HbA1c] levels) as exposures to primary open-angle glaucoma (POAG) in multi-ethnic populations. Single-nucleotide polymorphisms associated with exposure to T2D, FG, and HbA1c were selected as instrumental variables with significance (p < 5.0 × 10⁻⁸) from the genome-wide association study (GWAS)-based meta-analysis data available from the BioBank Japan and the UK Biobank (UKB). The GWAS for POAG was obtained from the meta-analyses of Genetic Epidemiology Research in Adult Health and Aging and the UKB. A two-sample Mendelian randomisation (MR) study was performed to assess the causal estimates using the inverse-variance weighted (IVW) method, and MR-Pleiotropy Residual Sum and Outlier test (MR-PRESSO). Significant causal associations of T2D (odds ratio [OR] = 1.05, 95% confidence interval [CI] = [1.00-1.10], p = 0.031 in IVW; OR = 1.06, 95% CI = [1.01-1.11], p = 0.017 in MR-PRESSO) and FG levels (OR = 1.19, 95% CI = [1.02-1.38], p = 0.026 in IVW; OR = 1.17, 95% CI = [1.01-1.35], p = 0.041 in MR-PRESSO) with POAG were observed, but not in HbA1c (all p > 0.05). The potential causal relationship between T2D or FG and POAG highlights its role in the prevention of POAG. Further investigation is necessary to authenticate these findings.
Keywords: fasting glucose; mendelian randomisation; primary open-angle glaucoma; single-nucleotide polymorphisms; type 2 diabetes.
Conflict of interest statement
The authors declare no conflicts of interest.
Figures
Similar articles
-
Potential Causal Association Between Atrial Fibrillation/Flutter and Primary Open-Angle Glaucoma: A Two-Sample Mendelian Randomisation Study.J Clin Med. 2024 Dec 16;13(24):7670. doi: 10.3390/jcm13247670. J Clin Med. 2024. PMID: 39768593 Free PMC article.
-
The genetic causal relationship between type 2 diabetes, glycemic traits and venous thromboembolism, deep vein thrombosis, pulmonary embolism: a two-sample Mendelian randomization study.Thromb J. 2024 Mar 29;22(1):33. doi: 10.1186/s12959-024-00600-z. Thromb J. 2024. PMID: 38553747 Free PMC article.
-
Causal Association between Iritis or Uveitis and Glaucoma: A Two-Sample Mendelian Randomisation Study.Genes (Basel). 2023 Mar 3;14(3):642. doi: 10.3390/genes14030642. Genes (Basel). 2023. PMID: 36980914 Free PMC article.
-
Habitual Coffee Consumption Increases Risk of Primary Open-Angle Glaucoma: A Mendelian Randomization Study.Ophthalmology. 2022 Sep;129(9):1014-1021. doi: 10.1016/j.ophtha.2022.04.027. Epub 2022 May 10. Ophthalmology. 2022. PMID: 35537532
-
Type 2 diabetes and glycemic traits are not causal factors of delirium: A two-sample mendelian randomization analysis.Front Genet. 2023 Feb 21;14:1087878. doi: 10.3389/fgene.2023.1087878. eCollection 2023. Front Genet. 2023. PMID: 36896238 Free PMC article.
Cited by
-
Potential Causal Association Between Atrial Fibrillation/Flutter and Primary Open-Angle Glaucoma: A Two-Sample Mendelian Randomisation Study.J Clin Med. 2024 Dec 16;13(24):7670. doi: 10.3390/jcm13247670. J Clin Med. 2024. PMID: 39768593 Free PMC article.
-
The effect of type 2 diabetes genetic predisposition on non-cardiovascular comorbidities.medRxiv [Preprint]. 2025 May 7:2025.05.05.25326966. doi: 10.1101/2025.05.05.25326966. medRxiv. 2025. PMID: 40385452 Free PMC article. Preprint.
-
Association between life's essential 8 cardiovascular health score and glaucoma risk: evidence from NHANES.Int Ophthalmol. 2025 Jun 11;45(1):237. doi: 10.1007/s10792-025-03620-4. Int Ophthalmol. 2025. PMID: 40498226 Free PMC article.
-
Research progress of Mendelian randomization analysis for glaucoma etiology.Int J Ophthalmol. 2025 Jul 18;18(7):1383-1397. doi: 10.18240/ijo.2025.07.23. eCollection 2025. Int J Ophthalmol. 2025. PMID: 40688780 Free PMC article. Review.
-
Associations between Disc Hemorrhage and Primary Open-Angle Glaucoma Based on Genome-Wide Association and Mendelian Randomization Analyses.Biomedicines. 2024 Oct 3;12(10):2253. doi: 10.3390/biomedicines12102253. Biomedicines. 2024. PMID: 39457566 Free PMC article.
References
Grants and funding
LinkOut - more resources
Full Text Sources
