. 2024 Apr 19;12(4):909.
doi: 10.3390/biomedicines12040909.

Exploring MiR-484 Regulation by Polyalthia longifolia: A Promising Biomarker and Therapeutic Target in Cervical Cancer through Integrated Bioinformatics and an In Vitro Analysis

Affiliations

Exploring MiR-484 Regulation by Polyalthia longifolia: A Promising Biomarker and Therapeutic Target in Cervical Cancer through Integrated Bioinformatics and an In Vitro Analysis

Jiaojiao Niu et al. Biomedicines. .

Abstract

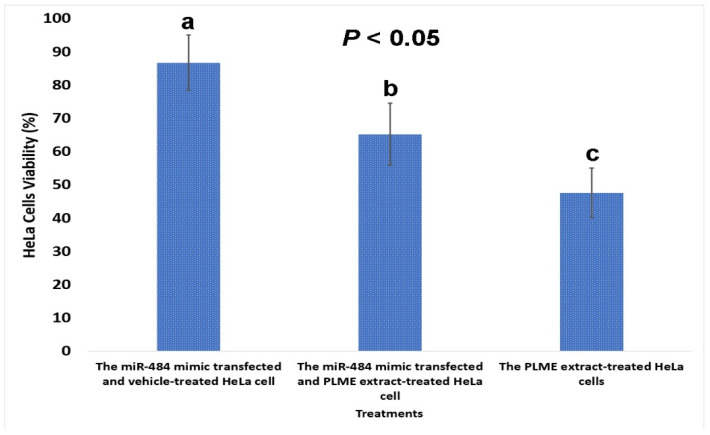
Background: MiR-484, implicated in various carcinomas, holds promise as a prognostic marker, yet its relevance to cervical cancer (CC) remains unclear. Our prior study demonstrated the Polyalthia longifolia downregulation of miR-484, inhibiting HeLa cells. This study investigates miR-484's potential as a biomarker and therapeutic target in CC through integrated bioinformatics and an in vitro analysis.

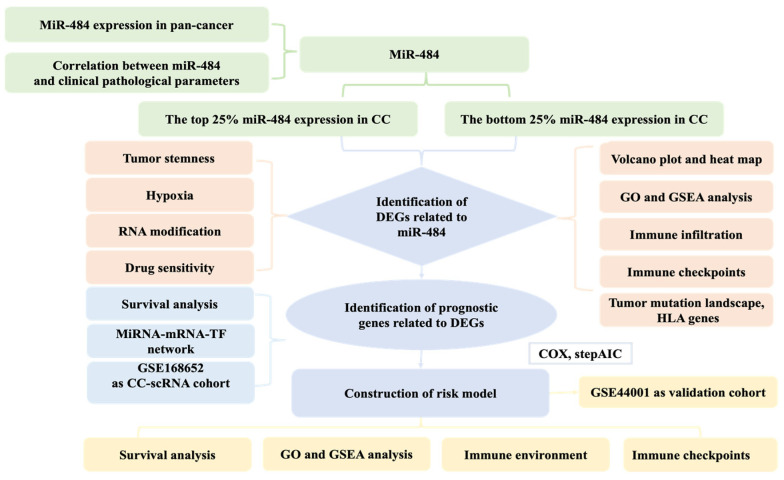
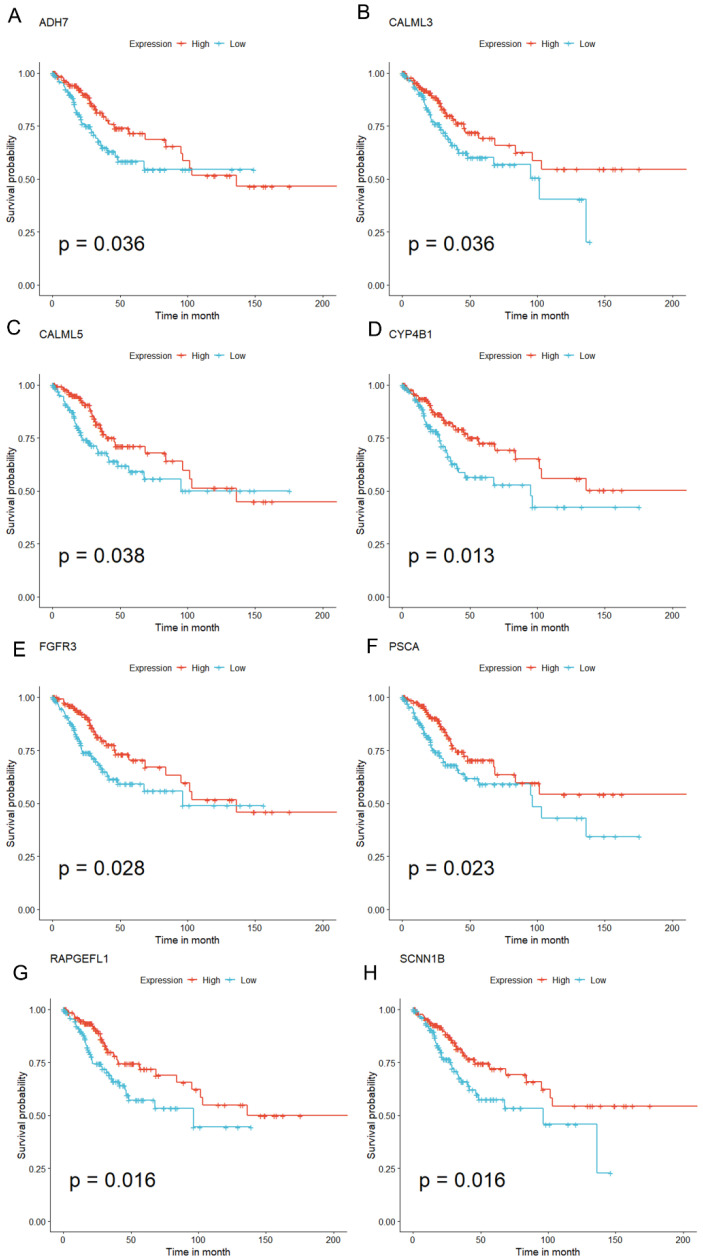
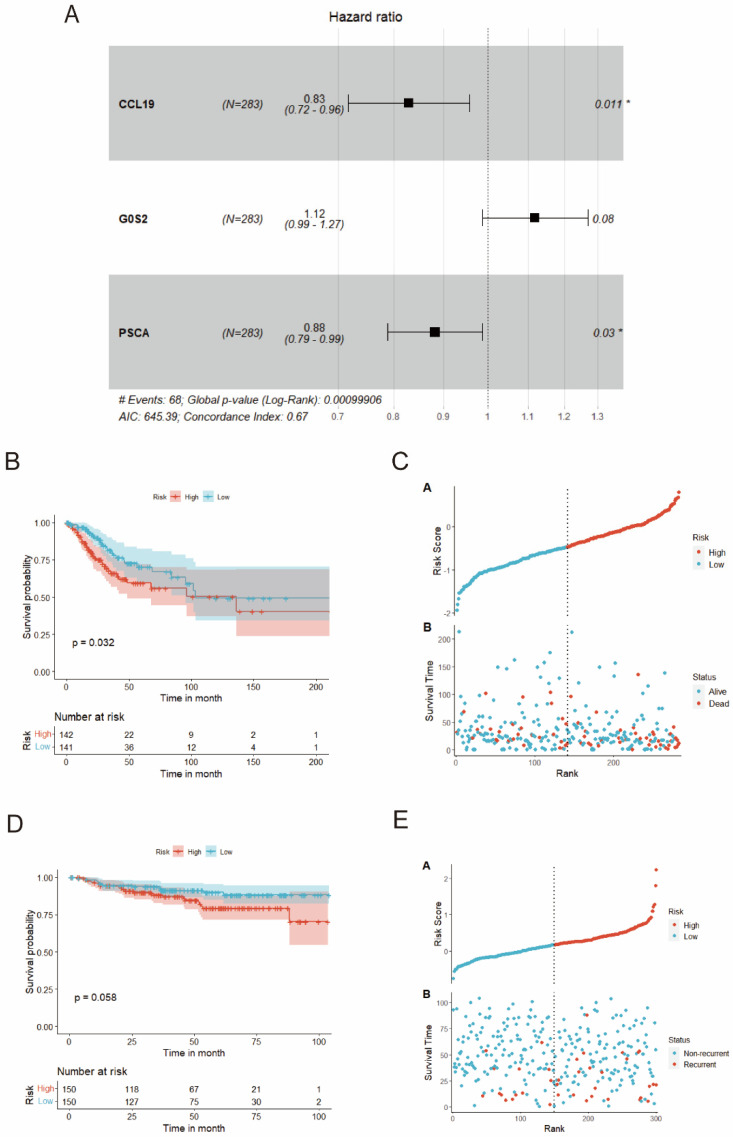
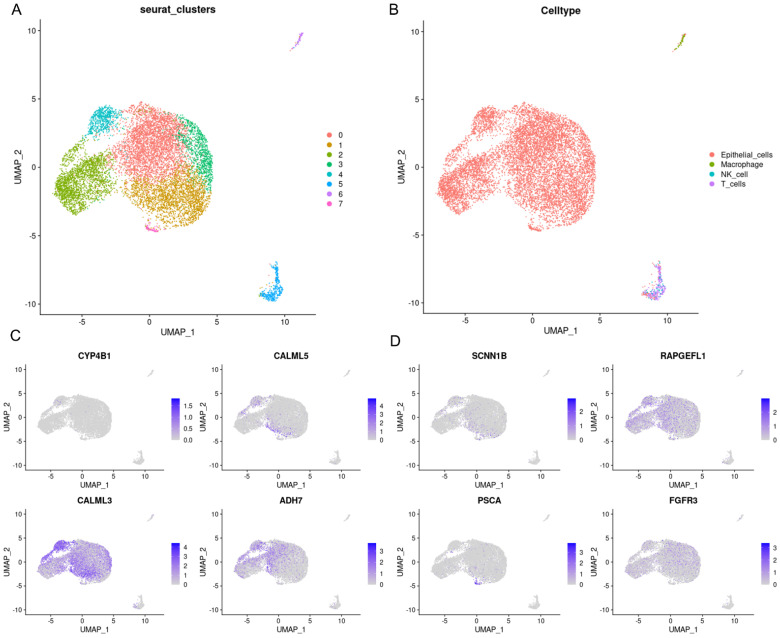
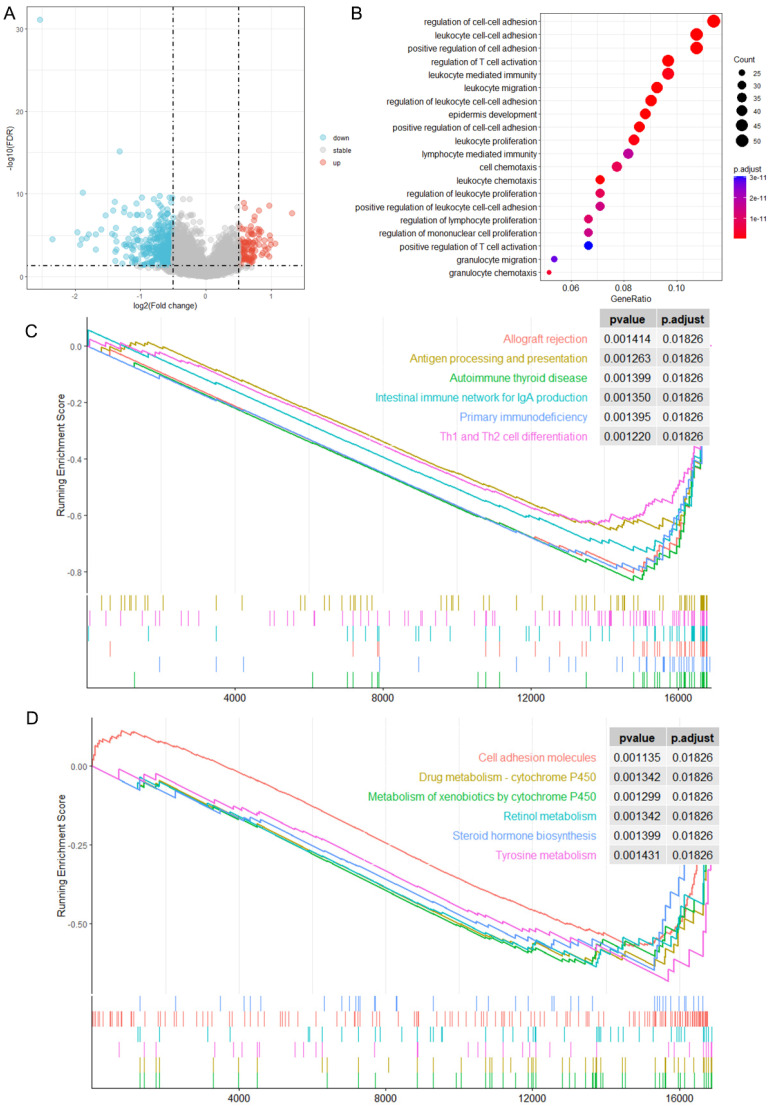
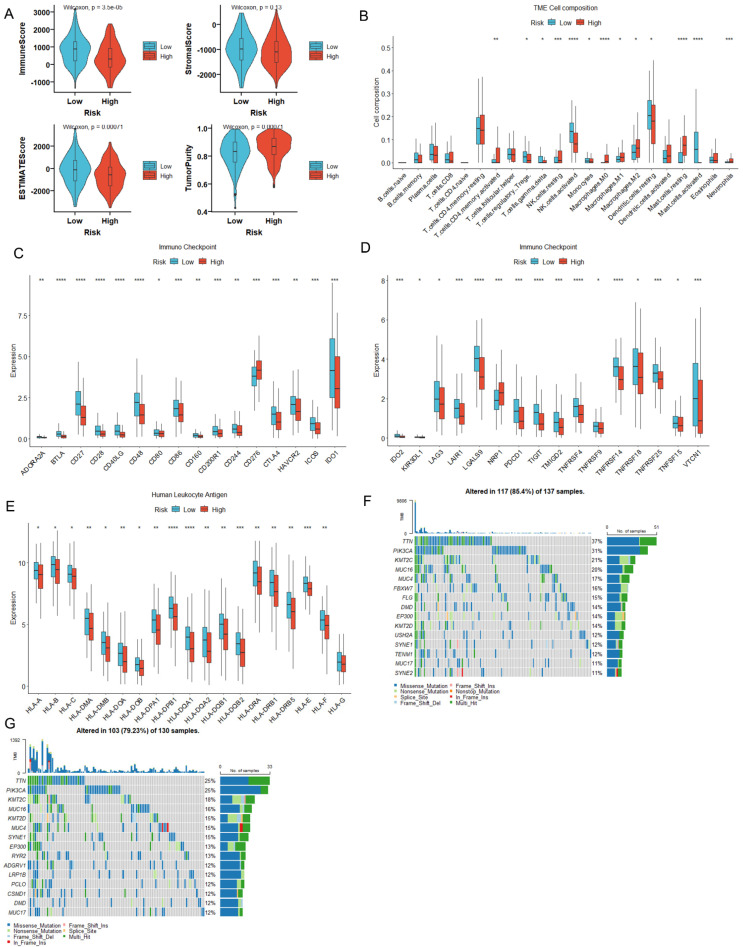
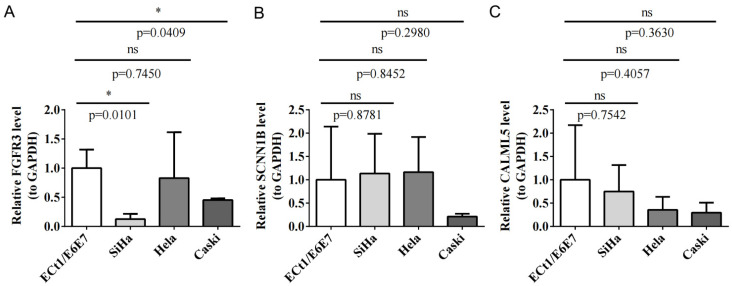
Methods: MiR-484 levels were analyzed across cancers, including CC, from The Cancer Genome Atlas. The limma R package identified differentially expressed genes (DEGs) between high- and low-miR-484 CC cohorts. We assessed biological functions, tumor microenvironment (TME), immunotherapy, stemness, hypoxia, RNA methylation, and chemosensitivity differences. Prognostic genes relevant to miR-484 were identified through Cox regression and Kaplan-Meier analyses, and a prognostic model was captured via multivariate Cox regression. Single-cell RNA sequencing determined cell populations related to prognostic genes. qRT-PCR validated key genes, and the miR-484 effect on CC proliferation was assessed via an MTT assay.

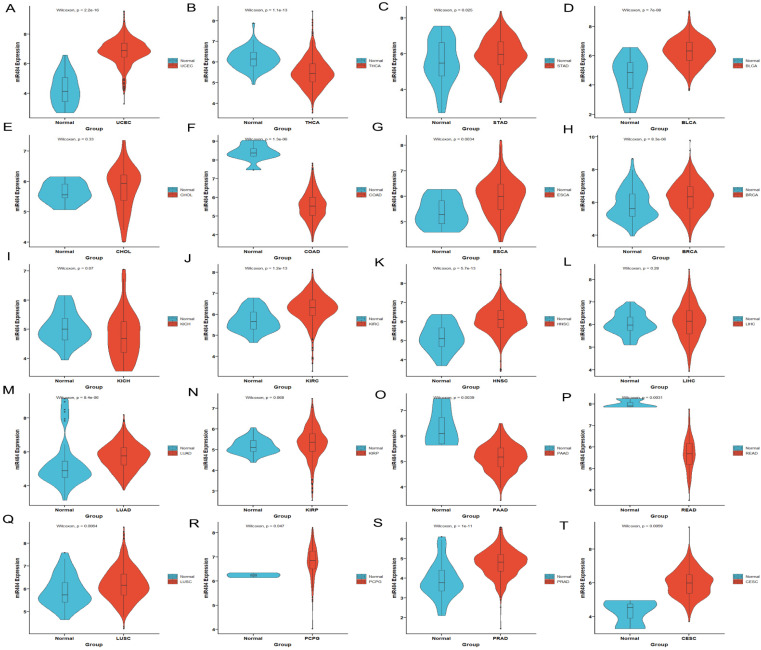
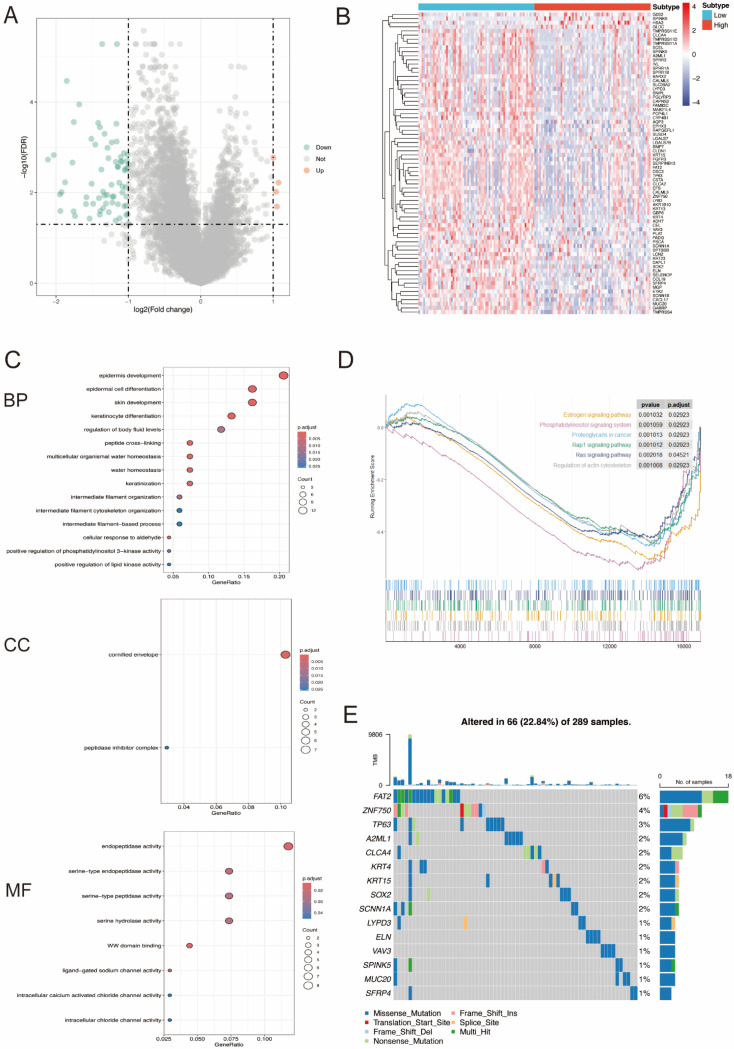
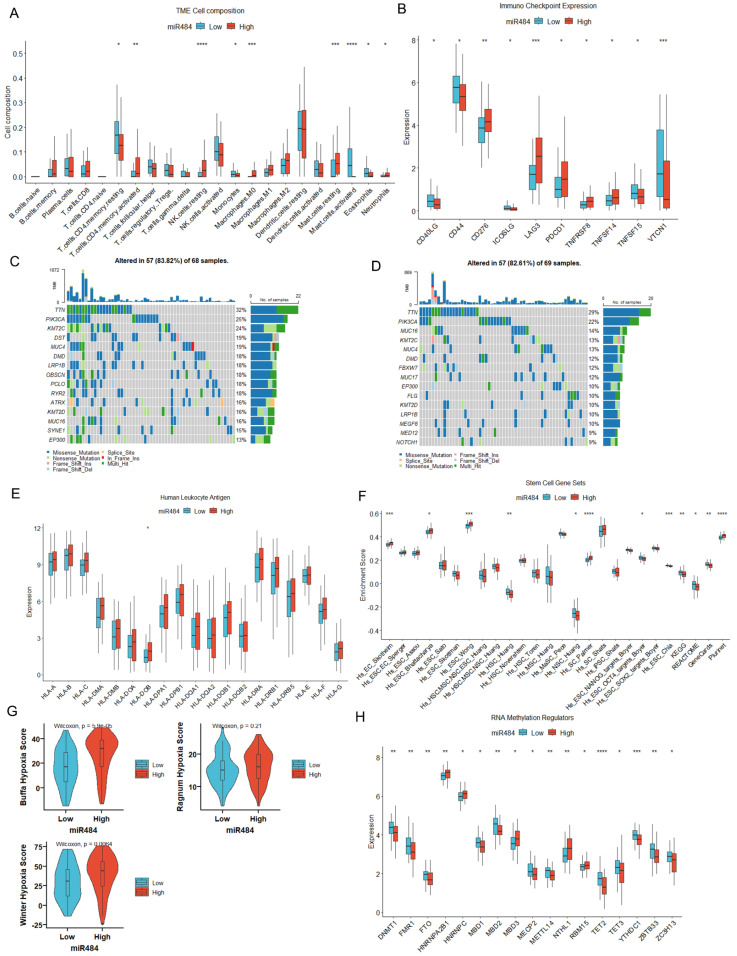
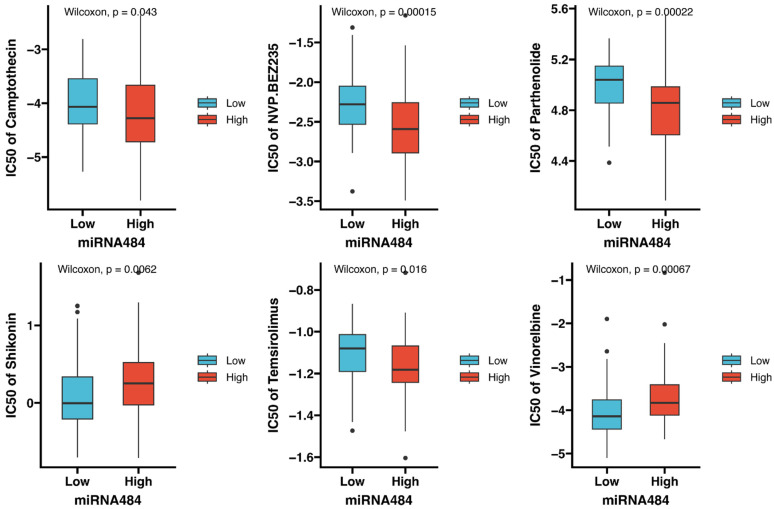
Results: MiR-484 was upregulated in most tumors, including CC, with DEGs enriched in skin development, PI3K signaling, and immune processes. High miR-484 expression correlated with specific immune cell infiltration, hypoxia, and drug sensitivity. Prognostic genes identified were predominantly epidermal and stratified patients with CC into risk groups, with the low-risk group showing enhanced survival and immunotherapeutic responses. qRT-PCR confirmed FGFR3 upregulation in CC cells, and an miR-484 mimic reversed the P. longifolia inhibitory effect on HeLa proliferation.

Conclusion: MiR-484 plays a crucial role in the CC progression and prognosis, suggesting its potential as a biomarker for targeted therapy.

Keywords: cervical cancer; immunotherapy; miR-484; prognostic genes; proliferation.


Conflict of interest statement

The authors declare no conflicts of interest.

Figures

Figure 1
Figure 1
The detailed flow chart of this study.
Figure 2
Figure 2
The analysis of miR-484 expression in pan-cancers. miR-484 expression is significantly upregulated in UCEC (n = 583) (A), STAD (n = 407) (C), BLCA (n = 430) (D), ESCA (n = 173) (G), BRCA (n = 1217) (H), KIRC (n = 607) (J), HNSC (n = 546) (K), LUAD (n = 585) (M), LUSC (n = 550) (Q), PCPG (n = 186) (R), PRAD (n = 551) (S), and CESC (n = 308) (T), while it is downregulated in THCA (n = 568) (B), COAD (n = 512) (F), PAAD (n = 182) (O), and READ (n = 177) (P). Moreover, there was no significant difference in the expression level of miR-484 among CHOL (E) (n = 45), KICH (I) (n = 89), HNSC (L) (n = 546) and KIRP (N) (n = 321). The value of ‘n’ represents the number of samples in each cancer type and ‘e’ represents exponent; p < 0.05 indicates statistical significance.
Figure 3
Figure 3
The analysis of miR-484-related DEGs. (A) The volcano plot shows 4 upregulated and 69 downregulated genes between high-miR-484 and low-miR-484 groups. The red and blue dots represent upregulated genes and downregulated genes, respectively. (B) The heatmap displays the expression level of 73 DEGs in each sample of different subgroups, with rows representing samples and columns representing DEGs. Samples were classified into the high-miR-484 and low-miR-484 groups, represented by red and blue bars in the figure, respectively. (C) A bar plot of GO enrichment in biological process terms, cellular component terms, and molecular function terms, respectively. (D) The gene set enrichment analysis (GSEA) of the altered signaling pathways in the 142 CC tissues based on the miR-484-associated DEGs. (E) The mutation landscape of miR-484-associated DEGs in CC tissues.
Figure 4
Figure 4
Analysis of immune landscape, tumor stemness, hypoxic landscape, and RNA modification in high- and low-miR-484 groups. (A) CIBERSORT algorithm showing differential infiltration levels of 22 immune cells between two subgroups. (B) Differential levels of ICPs between two subgroups in CC tissues. (C,D) Mutation landscape in high- and low-miR-484 groups of TCGA cohort. Differential levels of HLA family genes (E), tumor stemness genes (F), hypoxic scores (G), and RNA methylation regulators (H) between two subgroups in CC tissues (**** p < 0.0001; *** p < 0.001; ** p < 0.01; * p < 0.05).
Figure 5
Figure 5
The box plots illustrate the IC50 values of six therapeutic agents between high- and low-miR-484-expression groups. Camptothecin, NVP.BEZ235, Parthenolide, and Temsirolimus exhibited lower IC50 values in the high-miR-484 group, while Shikonin and Vinorelbine exhibited lower IC50 values in the low-miR-484 group. p < 0.05 indicates statistical significance.
Figure 6
Figure 6
Associations between miR-484-DEG expression and OS outcomes based on the Kaplan–Meier models. Patients were categorized into high- and low-expression cohorts based on the median expression level of miR-484 DEGs. Patients had better OS with elevated expressions of ADH7 (A), CALML3 (B), CALML5 (C), AYP4B1 (D), FGFR3 (E), PSCA (F), RAPGEFL1 (G), and SCNN1B (H).
Figure 7
Figure 7
Construction and validation of miR-484-DEG-related prognostic models. (A) Among DEGs relevant to miR-484, three prognostic genes were screened by multivariate Cox analysis (stepAIC). (B) Kaplan–Meier survival curves showing OS outcomes according to relative high-risk and low-risk patients in TCGA-CESC data (n = 283). (C) Point plots for assessing risk distribution of patients between high- and low-risk groups from TCGA-CESC data. (D) Kaplan–Meier survival curves showing OS outcomes according to relative high-risk and low-risk patients in GSE44001 data (n = 300). (E) Point plots for assessing risk distribution of patients between high- and low-risk groups from GSE44001 data. * p < 0.05 indicates statistical significance.
Figure 8
Figure 8
Single-cell sequencing analysis of GSE168652 and the cell localization of 8 prognostic genes associated with OS. (A) Cluster analysis and dimension reduction. All cells in GSE168652 were divided into 8 cell clusters. (B) The cells are categorized into epithelial cells, macrophages, NK cells, and T cells based on surface marker genes. (C,D) UMAP plots of the three prognostic genes.
Figure 9
Figure 9
Enrichment-based assessments for DEGs linked with risk score. (A) Volcano plot showing DEGs associated with risk group and red/blue reflect up/downregulated genes, respectively. (B) GO enrichment of risk-score-related DEGs. (C,D) Gene set enrichment analysis (GSEA) identifying the altered signaling pathways of risk-score-related DEGs in CC.
Figure 10
Figure 10
Immune landscape between high- and low-risk groups. (A) Differential expression of ESTIMATE score, immune score, stromal score, and tumor purity between two subgroups using ESTIMATE algorithm. (B) Differences in the infiltration levels of 22 immune cell types between two subgroups using CIBERSORT algorithm. Differential expression of ICP-related genes (C,D) and HLA genes (E) in the high- and low-risk groups. (F,G) Mutation landscape in the high- and low-risk groups of TCGA cohort (**** p < 0.0001; *** p < 0.001; ** p < 0.01; * p < 0.05).
Figure 11
Figure 11
The expression of key prognostic genes was analyzed between tumor and normal cell lines using qRT-PCR through Student’s t-test. FGFR3 was significantly downregulated in SiHa and Caski cells compared to the normal cell line ECt1/E6E7. (AC) represent FGFR3, SCNN1B, and CALML5, respectively. The data are expressed as the mean ± SD (n = 3), where * p ˂ 0.05 indicates statistical significance, ns = not significant.
Figure 12
Figure 12
Cell viability of HeLa cells with different treatments by MTT assay. The data are expressed as mean ± SD (n = 3). Different letters (a–c) indicate significant differences (p < 0.05) using one-way ANOVA, followed by Tukey’s multiple comparison tests.

Similar articles

References

    1. Charoentong P., Angelova M., Efremova M., Gallasch R., Hackl H., Galon J., Trajanoski Z. Bioinformatics for cancer immunology and immunotherapy. Cancer Immunol. Immunother. 2012;61:1885–1903. doi: 10.1007/s00262-012-1354-x. - DOI - PMC - PubMed
    1. Revathidevi S., Murugan A.K., Nakaoka H., Inoue I., Munirajan A.K. APOBEC: A molecular driver in cervical cancer pathogenesis. Cancer Lett. 2021;496:104–116. doi: 10.1016/j.canlet.2020.10.004. - DOI - PMC - PubMed
    1. Reddy K.B. MicroRNA (miRNA) in cancer. Cancer Cell Int. 2015;15:38. doi: 10.1186/s12935-015-0185-1. - DOI - PMC - PubMed
    1. Doghish A.S., Ali M.A., Elyan S.S., Elrebehy M.A., Mohamed H.H., Mansour R.M., Elgohary A., Ghanem A., Faraag A.H.I., Abdelmaksoud N.M., et al. miRNAs role in cervical cancer pathogenesis and targeted therapy: Signaling pathways interplay. Pathol. Res. Pract. 2023;244:154386. doi: 10.1016/j.prp.2023.154386. - DOI - PubMed
    1. Wang J.Y., Chen L.J. The role of miRNAs in the invasion and metastasis of cervical cancer. Biosci. Rep. 2019;39:BSR20181377. doi: 10.1042/BSR20181377. - DOI - PMC - PubMed

LinkOut - more resources