. 2024 Apr 22;12(4):927.
doi: 10.3390/biomedicines12040927.

Combined Metabolic Activators with Different NAD+ Precursors Improve Metabolic Functions in the Animal Models of Neurodegenerative Diseases

Affiliations

Combined Metabolic Activators with Different NAD+ Precursors Improve Metabolic Functions in the Animal Models of Neurodegenerative Diseases

Ozlem Altay et al. Biomedicines. .

Abstract

Background: Mitochondrial dysfunction and metabolic abnormalities are acknowledged as significant factors in the onset of neurodegenerative disorders such as Parkinson's disease (PD) and Alzheimer's disease (AD). Our research has demonstrated that the use of combined metabolic activators (CMA) may alleviate metabolic dysfunctions and stimulate mitochondrial metabolism. Therefore, the use of CMA could potentially be an effective therapeutic strategy to slow down or halt the progression of PD and AD. CMAs include substances such as the glutathione precursors (L-serine and N-acetyl cysteine), the NAD+ precursor (nicotinamide riboside), and L-carnitine tartrate.

Methods: Here, we tested the effect of two different formulations, including CMA1 (nicotinamide riboside, L-serine, N-acetyl cysteine, L-carnitine tartrate), and CMA2 (nicotinamide, L-serine, N-acetyl cysteine, L-carnitine tartrate), as well as their individual components, on the animal models of AD and PD. We assessed the brain and liver tissues for pathological changes and immunohistochemical markers. Additionally, in the case of PD, we performed behavioral tests and measured responses to apomorphine-induced rotations.

Findings: Histological analysis showed that the administration of both CMA1 and CMA2 formulations led to improvements in hyperemia, degeneration, and necrosis in neurons for both AD and PD models. Moreover, the administration of CMA2 showed a superior effect compared to CMA1. This was further corroborated by immunohistochemical data, which indicated a reduction in immunoreactivity in the neurons. Additionally, notable metabolic enhancements in liver tissues were observed using both formulations. In PD rat models, the administration of both formulations positively influenced the behavioral functions of the animals.

Interpretation: Our findings suggest that the administration of both CMA1 and CMA2 markedly enhanced metabolic and behavioral outcomes, aligning with neuro-histological observations. These findings underscore the promise of CMA2 administration as an effective therapeutic strategy for enhancing metabolic parameters and cognitive function in AD and PD patients.

Keywords: Alzheimer’s disease; Parkinson’s disease; animal models; combined metabolic activators.


Conflict of interest statement

A.M., J.B. and M.U. are the founder and shareholders of ScandiBio Therapeutics. The remaining authors declare that the research was conducted in the absence of any commercial or financial relationships that could be construed as a potential conflict of interest. ScandiBio Therapeutics had no role in the design of the study; in the collection, analyses, or interpretation of data; in the writing of the manuscript, or in the decision to publish the results.

Figures

Figure 1
Figure 1
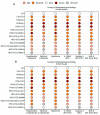
The effect of CMA administration in AD-like animal model. (A) Overview of the study design and group information. The left side of the image describes how the AD-like animal model was generated. Group 1 (n = 4) was fed with chow diet (CD) for 5 weeks; Group 2 (n = 4) was fed with CD and treated with streptozotocin (STZ). The syringe icon shows the STZ injection in the third week. Group 3 (n = 4) was fed with a high-fat diet (HFD) for only 3 weeks, and group 4 (n = 4) was fed with HFD for 5 weeks. Group 5 (n = 2) was fed with HFD for 5 weeks and treated with streptozotocin (STZ). The right side of the image describes a drug administration study. Groups 6–13 were fed with HFD for 5 weeks. In the third week, animals were treated with STZ and administered with individual or combined metabolic activators for 2 weeks. (B) Heatmap shows FC-based relative alterations of the clinical variables in the rat study groups. Asterisks (*) indicate statistical significance based on one-way ANOVA or Mann–Whitney U test, p-value < 0.05 is considered statistical significance. HFD: high-fat diet, Ser: L-serine, NAC: N-acetyl-L-cysteine, LCAT: L-carnitine tartrate, NR: nicotinamide riboside, NAM: nicotinamide, TG: triglyceride, TC: total cholesterol, ALP: alkaline phosphatase, AST: aspartate aminotransferase, ALT: alanine aminotransferase, HDL: high-density lipoprotein, LDL: low-density lipoprotein, LDH: lactate dehydrogenase, CMA1: Combined Metabolic Activators 1; CMA2: Combined Metabolic Activators 2; FC: Fold change. The results from CMA1 and its individual components have been reported earlier [35].
Figure 2
Figure 2
Histopathological, immunohistochemical and immunofluorescence images of rat tissues in the AD-like animal model. Histopathological image analysis results of rat (A) brain and (B) liver tissue. Slides evaluated by two independent pathologists and immunopositivity scores were: None (−), very mild (+), mild (++), moderate (+++), severe (++++), and very severe (+++++). HFD: high-fat diet, STZ: streptozotocin, Ser: L-serine, NAC: N-acetyl-L-cysteine, LCAT: L-carnitine tartrate, NR: nicotinamide riboside, NAM: nicotinamide, CMA1: Combined Metabolic Activators 1, CMA2: Combined Metabolic Activators 2. The results from CMA1 and its individual components have been reported earlier [35].
Figure 3
Figure 3
Administration of CMA shows beneficial effects on plasma parameters in PD-like animal models. (A) Overview of the study design and group information. The left side of the image describes how the PD-like animal model was generated. Group 1 (n = 3) was fed with a chow diet (CD) for 5 weeks; Group 2 (n = 3) was fed with CD and treated with 6-OHDA. The syringe icon shows the 6-OHDA injection in the third week. Group 3 (n = 3) was fed with a high-fat diet (HFD) for 5 weeks. Group 4 (n = 3) was fed with HFD and treated with 6-OHDA. The right side of the figure describes drug administration studies. Groups 5–12 were fed with HFD for 5 weeks. In the third week, the animals were treated with 6-OHDA and administered with individual or combined metabolic activators for 2 weeks. (B) Heatmap plot shows log2FC of biochemical variables between treated groups (administered with individual or CMA) and HFD plus 6-OHDA group. Asterisk (*) denotes statistical significance (p < 0.05). The difference and p-value are estimated by one-way ANOVA or Mann–Whitney U test. CD: chow diet, 6-OHDA: 6-hydroxydopamine hydrochloride, HFD: high-fat diet, Ser: L-serine, NAC: N-acetyl-L-cysteine, LCAT: L-carnitine tartrate, NR: nicotinamide riboside, NAM: nicotinamide, CMA1: Combined Metabolic Activators 1, CMA2: Combined Metabolic Activators 2, ALP: alkaline phosphatase, ALT: alanine aminotransferase, AST: aspartate transaminase, BUN: blood urea nitrogen, HCT: hematocrit, HDL: high-density lipoprotein, HGB: hemoglobin, LDH: lactate dehydrogenase, LDL: low-density lipoprotein, MCH: mean corpuscular hemoglobin; MCHC: mean corpuscular hemoglobin concentration, MCV: mean corpuscular volume, PLT: platelet (thrombocyte) count, RBC: red blood cell, WBC: white blood cell, log2FC: log transformation fold change. The results from CMA1 and its individual components have been reported earlier [35].
Figure 4
Figure 4
Immunohistopathological examination of brain and liver tissues in PD-like animal model. (A) Histopathological image analysis results of rat brain and liver tissue. Slides evaluated by two independent pathologists and immunopositivity scores were: None (−), very mild (+), mild (++), moderate (+++), severe (++++), and very severe (+++++). (B) Bar plot shows immunohistochemical and immunofluorescent findings in brain and liver tissues. Asterisk (***) denotes statistical significance (p < 0.05). The difference and p-value are estimated by one-way ANOVA or Mann–Whitney U test. CD: chow diet, 6-OHDA: 6-hydroxydopamine hydrochloride, HFD: high-fat diet, Ser: L-serine, NAC: N-acetyl-L-cysteine, LCAT: L-carnitine tartrate, NR: nicotinamide riboside, NAM: nicotinamide, CMA1: Combined Metabolic Activators 1, CMA2: Combined Metabolic Activators 2, IF: immunofluorescence; IHC: immunohistochemistry. The results from CMA1 and its individual components have been reported earlier [35].
Figure 5
Figure 5
Administration of CMA shows beneficial effects on behavioral functions in PD-like animal models. Boxplot showing the changes in locomotor activity in each group. The comparison was applied between the treated groups and the HFD plus 6-OHDA group. CD: chow diet, 6-OHDA: 6-hydroxydopamine hydrochloride, HFD: high-fat diet, Ser: L-serine, NAC: N-acetyl-L-cysteine, LCAT: L-carnitine tartrate, NR: nicotinamide riboside, NAM: nicotinamide, CMA1: Combined Metabolic Activators 1, CMA2: Combined Metabolic Activators 2. The results from CMA1 and its individual components have been reported earlier [35].

Similar articles

Cited by

References

    1. World Health Organization Dementia 2022. [(accessed on 29 October 2023)]. Available online: https://www.who.int/news-room/fact-sheets/detail/dementia.
    1. Azam S., Haque M.E., Balakrishnan R., Kim I.-S., Choi D.-K. The Ageing Brain: Molecular and Cellular Basis of Neurodegeneration. Front. Cell Dev. Biol. 2021;9:683459. doi: 10.3389/fcell.2021.683459. - DOI - PMC - PubMed
    1. Butterfield D.A., Halliwell B. Oxidative stress, dysfunctional glucose metabolism and Alzheimer disease. Nat. Rev. Neurosci. 2019;20:148–160. doi: 10.1038/s41583-019-0132-6. - DOI - PMC - PubMed
    1. Bassendine M.F., Taylor-Robinson S.D., Fertleman M., Khan M., Neely D. Is Alzheimer’s Disease a Liver Disease of the Brain? J. Alzheimers Dis. 2020;75:1–14. doi: 10.3233/JAD-190848. - DOI - PMC - PubMed
    1. Haxaire C., Turpin F.R., Potier B., Kervern M., Sinet P.M., Barbanel G., Mothet J.P., Dutar P., Billard J.M. Reversal of age-related oxidative stress prevents hippocampal synaptic plasticity deficits by protecting D-serine-dependent NMDA receptor activation. Aging Cell. 2012;11:336–344. doi: 10.1111/j.1474-9726.2012.00792.x. - DOI - PubMed

LinkOut - more resources