. 2024 Apr 18;14(4):490.
doi: 10.3390/biom14040490.

Elevated Serum Xanthine Oxidase and Its Correlation with Antioxidant Status in Patients with Parkinson's Disease

Affiliations

Elevated Serum Xanthine Oxidase and Its Correlation with Antioxidant Status in Patients with Parkinson's Disease

Ratna Dini Haryuni et al. Biomolecules. .

Abstract

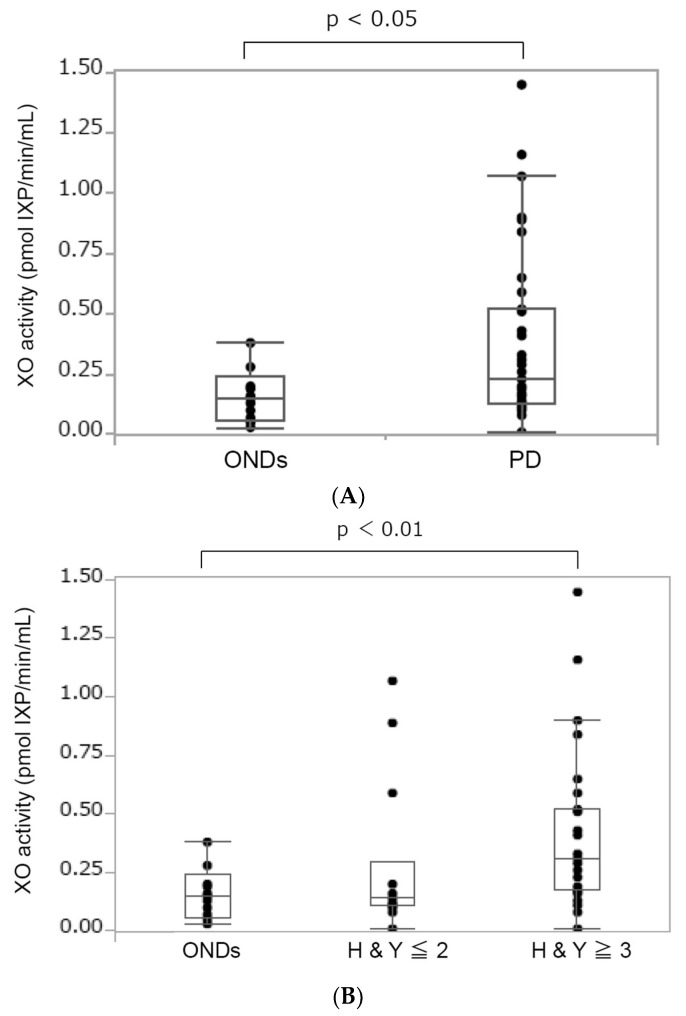
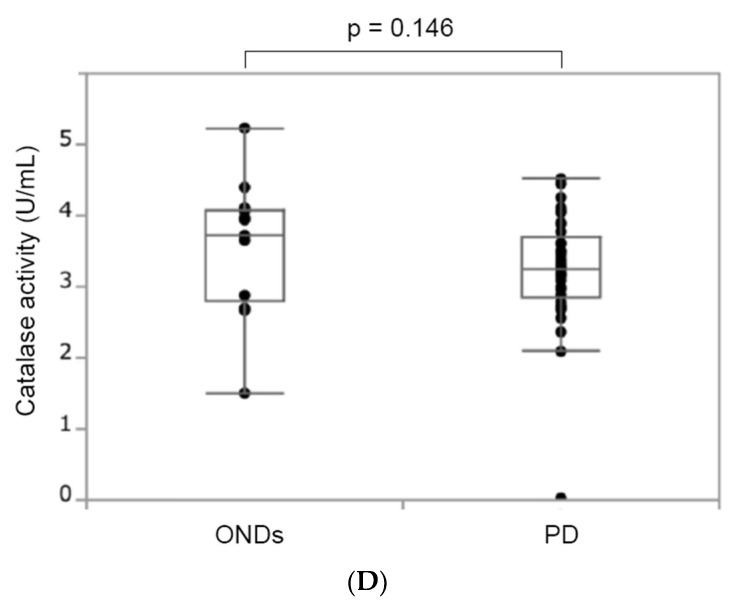
Parkinson's disease (PD) is a neurodegenerative movement disorder associated with a loss of dopamine neurons in the substantia nigra. The diagnosis of PD is sensitive since it shows clinical features that are common with other neurodegenerative diseases. In addition, most symptoms arise at the late stage of the disease, where most dopaminergic neurons are already damaged. Several studies reported that oxidative stress is a key modulator in the development of PD. This condition occurs due to excess reactive oxygen species (ROS) production in the cellular system and the incapability of antioxidants to neutralize it. In this study, we focused on the pathology of PD by measuring serum xanthine oxidase (XO) activity, which is an enzyme that generates ROS. Interestingly, the serum XO activity of patients with PD was markedly upregulated compared to patients with other neurological diseases (ONDs) as a control. Moreover, serum XO activity in patients with PD showed a significant correlation with the disease severity based on the Hoehn and Yahr (HY) stages. The investigation of antioxidant status also revealed that serum uric acid levels were significantly lower in the severe group (HY ≥ 3) than in the ONDs group. Together, these results suggest that XO activity may contribute to the development of PD and might potentially be a biomarker for determining disease severity in patients with PD.

Keywords: Parkinson’s disease; oxidative stress; xanthine oxidase.


Conflict of interest statement

Author Takashi Shirakura and Chieko Matsui are employed by the company Teijin Pharma Ltd. The remaining authors declare that the research was conducted in the absence of any commercial or financial relationships that could be construed as a potential conflict of interest.

Figures

Figure 1
Figure 1
The boxplot of serum XO activity in patients with ONDs and those with PD. (A) The boxplot of serum XO activity in patients with other neurological diseases (ONDs) and those with PD. The median (interquartile range) serum XO activity was 0.15 (0.06–0.24) and 0.23 (0.13–0.52) pmol XP/min/mL, respectively. The Wilcoxon test was used to compare the two groups. A p-value < 0.05 indicates statistical significance. (B) The boxplot of serum XO activity in the patients with ONDs and PD. The median (interquartile range) serum XO activity was 0.15 (0.06–0.24), 0.14 (0.10–0.29), and 0.29 (0.16–0.52) pmol XP/min/mL in patients with ONDs (n = 13), PD HY ≤ 2 (n = 14), and PD HY ≥ 3 (n = 27), respectively. The Wilcoxon test with Holm correction was used to compare the three groups. A value of p < 0.05 indicates statistical significance. (C) Correlation between CSF ATP levels and the Hoehn and Yahr stages. Spearman’s test adjusted for age, sex, disease duration, and age of onset was used to examine the correlation between variables. r = correlation (95% CI). A p-value < 0.05 indicates statistical significance.
Figure 1
Figure 1
The boxplot of serum XO activity in patients with ONDs and those with PD. (A) The boxplot of serum XO activity in patients with other neurological diseases (ONDs) and those with PD. The median (interquartile range) serum XO activity was 0.15 (0.06–0.24) and 0.23 (0.13–0.52) pmol XP/min/mL, respectively. The Wilcoxon test was used to compare the two groups. A p-value < 0.05 indicates statistical significance. (B) The boxplot of serum XO activity in the patients with ONDs and PD. The median (interquartile range) serum XO activity was 0.15 (0.06–0.24), 0.14 (0.10–0.29), and 0.29 (0.16–0.52) pmol XP/min/mL in patients with ONDs (n = 13), PD HY ≤ 2 (n = 14), and PD HY ≥ 3 (n = 27), respectively. The Wilcoxon test with Holm correction was used to compare the three groups. A value of p < 0.05 indicates statistical significance. (C) Correlation between CSF ATP levels and the Hoehn and Yahr stages. Spearman’s test adjusted for age, sex, disease duration, and age of onset was used to examine the correlation between variables. r = correlation (95% CI). A p-value < 0.05 indicates statistical significance.
Figure 2
Figure 2
Antioxidant levels in patients with ONDs and those with PD. (A) The boxplot of serum uric acid levels in patients with ONDs and those with PD. The median (interquartile range) serum uric acid level in the ONDs group was 5.65 (4.4–7.025), and that in the PD group was 4.6 (3.725–5.2) mg/dL. When comparing serum uric acid, ONDs included 10 patients, and PD included 36 patients. In the ONDs group, three patients taking anti-hyperuricemic drugs were excluded. In patients with PD, two patients taking anti-hyperuricemic drugs and three patients without any data on serum uric acid were excluded (HY ≤ 2 group included 12 patients and HY. The ≥ 3 group included 24 patients). (B) The boxplot of serum uric acid levels in patients with ONDs and those with PD. The median (interquartile range) serum uric acid levels were 5.7 (4.4–6.95), 4.95 (3.5–6.7), and 4.4 (3.775–5.175) pmol XP/min/mL in patients with ONDs, PD HY ≤ 2 (n = 12), and PD HY ≥ 3 (n = 24), respectively. The Wilcoxon test with Holm correction was used for comparing the three groups. A p-value < 0.05 indicates statistical significance. (C) Correlation between serum XO activity and serum uric acid in 36 patients with PD (r = 0.1855, p = 0.2788). (D) The boxplot of serum catalase in patients with ONDs and those with PD. There were no significant differences (p = 0.146) in catalase activity between the ONDs group with a median (inter-quartile range) of 3.73 (2.79–4.09) and the PD group with a median of 3.25 (2.84–3.70). The Wilcoxon test was used to compare the two groups. A p-value < 0.05 was considered statistically significant.
Figure 2
Figure 2
Antioxidant levels in patients with ONDs and those with PD. (A) The boxplot of serum uric acid levels in patients with ONDs and those with PD. The median (interquartile range) serum uric acid level in the ONDs group was 5.65 (4.4–7.025), and that in the PD group was 4.6 (3.725–5.2) mg/dL. When comparing serum uric acid, ONDs included 10 patients, and PD included 36 patients. In the ONDs group, three patients taking anti-hyperuricemic drugs were excluded. In patients with PD, two patients taking anti-hyperuricemic drugs and three patients without any data on serum uric acid were excluded (HY ≤ 2 group included 12 patients and HY. The ≥ 3 group included 24 patients). (B) The boxplot of serum uric acid levels in patients with ONDs and those with PD. The median (interquartile range) serum uric acid levels were 5.7 (4.4–6.95), 4.95 (3.5–6.7), and 4.4 (3.775–5.175) pmol XP/min/mL in patients with ONDs, PD HY ≤ 2 (n = 12), and PD HY ≥ 3 (n = 24), respectively. The Wilcoxon test with Holm correction was used for comparing the three groups. A p-value < 0.05 indicates statistical significance. (C) Correlation between serum XO activity and serum uric acid in 36 patients with PD (r = 0.1855, p = 0.2788). (D) The boxplot of serum catalase in patients with ONDs and those with PD. There were no significant differences (p = 0.146) in catalase activity between the ONDs group with a median (inter-quartile range) of 3.73 (2.79–4.09) and the PD group with a median of 3.25 (2.84–3.70). The Wilcoxon test was used to compare the two groups. A p-value < 0.05 was considered statistically significant.

Similar articles

Cited by

References

    1. Kalia L.V., Lang A.E. Parkinson’s disease. Lancet. 2015;386:896–912. doi: 10.1016/S0140-6736(14)61393-3. - DOI - PubMed
    1. Dickson D.W. Parkinson’s disease and parkinsonism: Neuropathology. Cold Spring Harb. Perspect. Med. 2012;2:a009258. doi: 10.1101/cshperspect.a009258. - DOI - PMC - PubMed
    1. Guo J.D., Zhao X., Li Y., Li G.R., Liu X.L. Damage to dopaminergic neurons by oxidative stress in Parkinson’s disease (Review) Int. J. Mol. Med. 2018;41:1817–1825. doi: 10.3892/ijmm.2018.3406. - DOI - PubMed
    1. Angelova P.R., Abramov A.Y. Role of mitochondrial ROS in the brain: From physiology to neurodegeneration. FEBS Lett. 2018;592:692–702. doi: 10.1002/1873-3468.12964. - DOI - PubMed
    1. Popa-Wagner A., Mitran S., Sivanesan S., Chang E., Buga A.M. ROS and brain diseases: The good, the bad, and the ugly. Oxid. Med. Cell Longev. 2013;2013:963520. doi: 10.1155/2013/963520. - DOI - PMC - PubMed

Publication types