

Upregulated Matrisomal Proteins and Extracellular Matrix Mechanosignaling Underlie Obesity-Associated Promotion of Pancreatic Ductal Adenocarcinoma
- PMID: 38672675
- PMCID: PMC11048773
- DOI: 10.3390/cancers16081593
Upregulated Matrisomal Proteins and Extracellular Matrix Mechanosignaling Underlie Obesity-Associated Promotion of Pancreatic Ductal Adenocarcinoma
Abstract
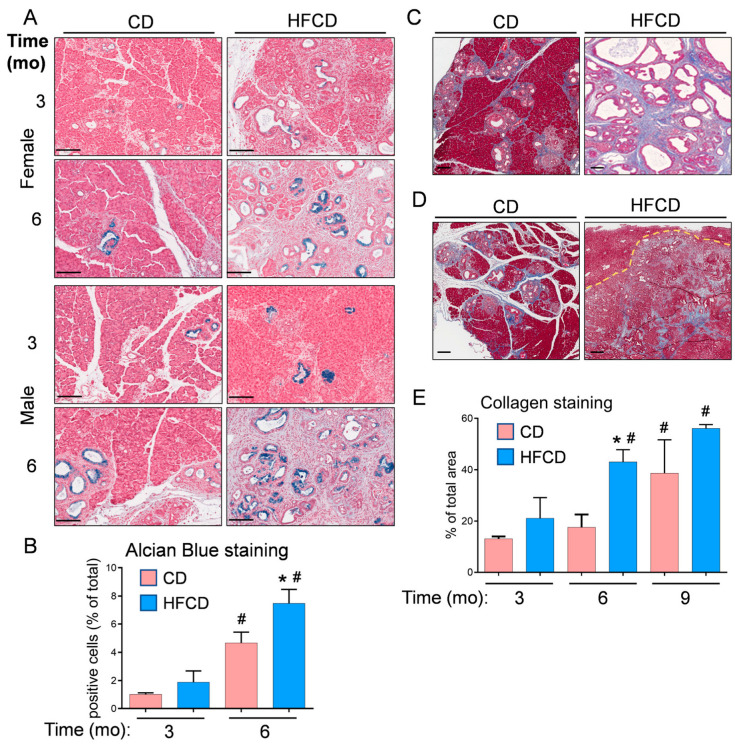
Diet-induced obesity (DIO) promotes pancreatic ductal adenocarcinoma (PDAC) in mice expressing KRasG12D in the pancreas (KC mice), but the precise mechanisms remain unclear. Here, we performed multiplex quantitative proteomic and phosphoproteomic analysis by liquid chromatography-tandem mass spectrometry and further bioinformatic and spatial analysis of pancreas tissues from control-fed versus DIO KC mice after 3, 6, and 9 months. Normal pancreatic parenchyma and associated proteins were steadily eliminated and the novel proteins, phosphoproteins, and signaling pathways associated with PDAC tumorigenesis increased until 6 months, when most males exhibited cancer, but females did not. Differentially expressed proteins and phosphoproteins induced by DIO revealed the crucial functional role of matrisomal proteins, which implies the roles of upstream regulation by TGFβ, extracellular matrix-receptor signaling to downstream PI3K-Akt-mTOR-, MAPK-, and Yap/Taz activation, and crucial effects in the tumor microenvironment such as metabolic alterations and signaling crosstalk between immune cells, cancer-associated fibroblasts (CAFs), and tumor cells. Staining tissues from KC mice localized the expression of several prognostic PDAC biomarkers and elucidated tumorigenic features, such as robust macrophage infiltration, acinar-ductal metaplasia, mucinous PanIN, distinct nonmucinous atypical flat lesions (AFLs) surrounded by smooth muscle actin-positive CAFs, invasive tumors with epithelial-mesenchymal transition arising close to AFLs, and expanding deserted areas by 9 months. We next used Nanostring GeoMX to characterize the early spatial distribution of specific immune cell subtypes in distinct normal, stromal, and PanIN areas. Taken together, these data richly contextualize DIO promotion of Kras-driven PDAC tumorigenesis and provide many novel insights into the signaling pathways and processes involved.
Keywords: KC mice; atypical flat lesions; diet-induced obesity; extracellular matrix; matrisomal proteins; pancreatic ductal adenocarcinoma; prognostic biomarkers; quantitative proteomic analysis; tandem mass tags; tumor microenvironment.
Conflict of interest statement
The authors declare no potential conflicts of interest.
Figures


Similar articles
-
Krüppel-like Factor 5, Increased in Pancreatic Ductal Adenocarcinoma, Promotes Proliferation, Acinar-to-Ductal Metaplasia, Pancreatic Intraepithelial Neoplasia, and Tumor Growth in Mice.Gastroenterology. 2018 Apr;154(5):1494-1508.e13. doi: 10.1053/j.gastro.2017.12.005. Epub 2017 Dec 15. Gastroenterology. 2018. PMID: 29248441 Free PMC article.
-
Hes1 plays an essential role in Kras-driven pancreatic tumorigenesis.Oncogene. 2019 May;38(22):4283-4296. doi: 10.1038/s41388-019-0718-5. Epub 2019 Jan 31. Oncogene. 2019. PMID: 30705405
-
PYK2 Is Involved in Premalignant Acinar Cell Reprogramming and Pancreatic Ductal Adenocarcinoma Maintenance by Phosphorylating β-CateninY654.Cell Mol Gastroenterol Hepatol. 2019;8(4):561-578. doi: 10.1016/j.jcmgh.2019.07.004. Epub 2019 Jul 19. Cell Mol Gastroenterol Hepatol. 2019. PMID: 31330317 Free PMC article.
-
Biological Significance of YAP/TAZ in Pancreatic Ductal Adenocarcinoma.Front Oncol. 2021 Jul 29;11:700315. doi: 10.3389/fonc.2021.700315. eCollection 2021. Front Oncol. 2021. PMID: 34395269 Free PMC article. Review.
-
Notch signaling pathway in pancreatic tumorigenesis.Adv Cancer Res. 2023;159:1-36. doi: 10.1016/bs.acr.2023.02.001. Epub 2023 Feb 28. Adv Cancer Res. 2023. PMID: 37268393 Review.
Cited by
-
Combined effects of matrix stiffness and obesity-associated signaling directs progressive phenotype in PANC-1 pancreatic cancer cells in vitro.bioRxiv [Preprint]. 2024 Jun 14:2024.06.11.598541. doi: 10.1101/2024.06.11.598541. bioRxiv. 2024. PMID: 38915620 Free PMC article. Preprint.
References
-
- Hingorani S.R., Petricoin E.F., Maitra A., Rajapakse V., King C., Jacobetz M.A., Ross S., Conrads T.P., Veenstra T.D., Hitt B.A., et al. Preinvasive and invasive ductal pancreatic cancer and its early detection in the mouse. Cancer Cell. 2003;4:437–450. doi: 10.1016/S1535-6108(03)00309-X. - DOI - PubMed
-
- Guerra C., Schuhmacher A.J., Canamero M., Grippo P.J., Verdaguer L., Perez-Gallego L., Dubus P., Sandgren E.P., Barbacid M. Chronic pancreatitis is essential for induction of pancreatic ductal adenocarcinoma by K-Ras oncogenes in adult mice. Cancer Cell. 2007;11:291–302. doi: 10.1016/j.ccr.2007.01.012. - DOI - PubMed
-
- Dawson D.W., Hertzer K., Moro A., Donald G., Chang H.H., Go V.L., Pandol S.J., Lugea A., Gukovskaya A.S., Li G., et al. High-fat, high-calorie diet promotes early pancreatic neoplasia in the conditional KrasG12D mouse model. Cancer Prev. Res. 2013;6:1064–1073. doi: 10.1158/1940-6207.CAPR-13-0065. - DOI - PMC - PubMed
Grants and funding
LinkOut - more resources
Full Text Sources
Molecular Biology Databases
Miscellaneous
