

Unveiling Gene Expression Dynamics during Early Embryogenesis in Cynoglossus semilaevis: A Transcriptomic Perspective
- PMID: 38672775
- PMCID: PMC11050975
- DOI: 10.3390/life14040505
Unveiling Gene Expression Dynamics during Early Embryogenesis in Cynoglossus semilaevis: A Transcriptomic Perspective
Abstract
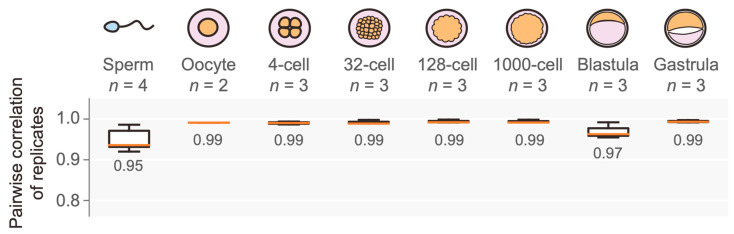
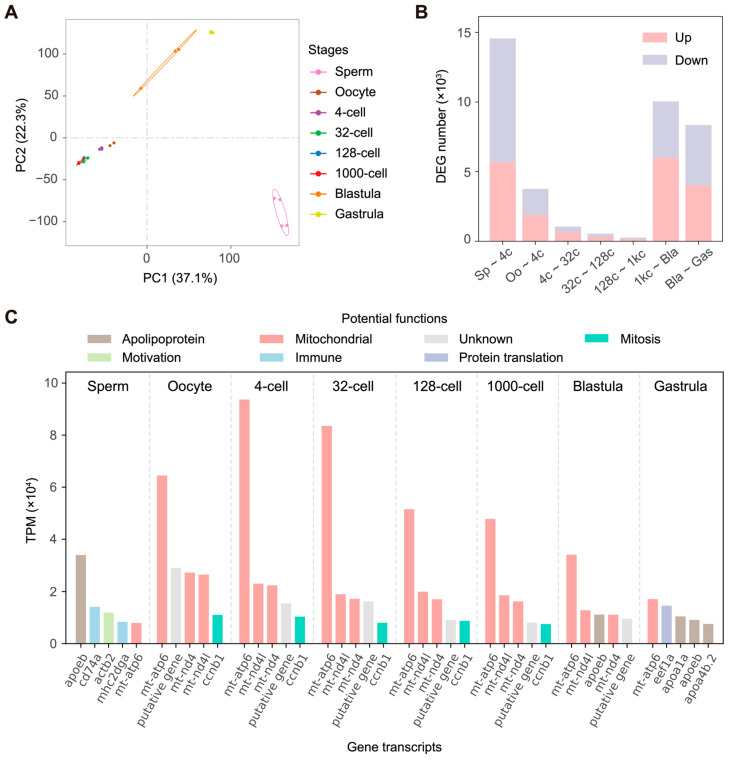
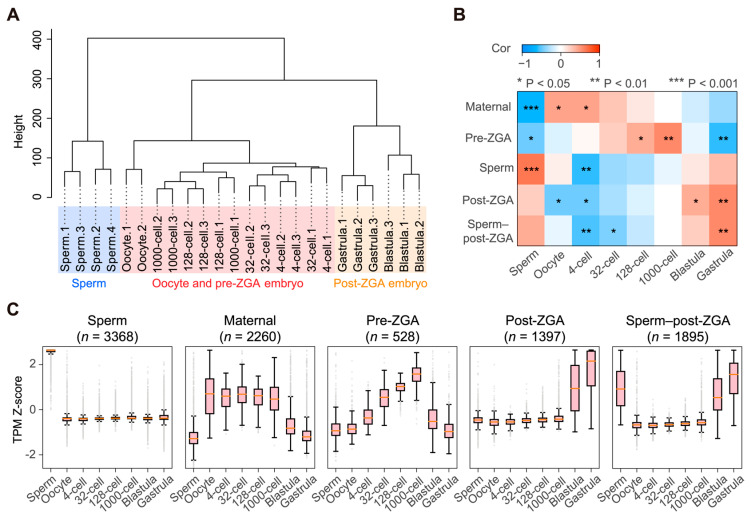
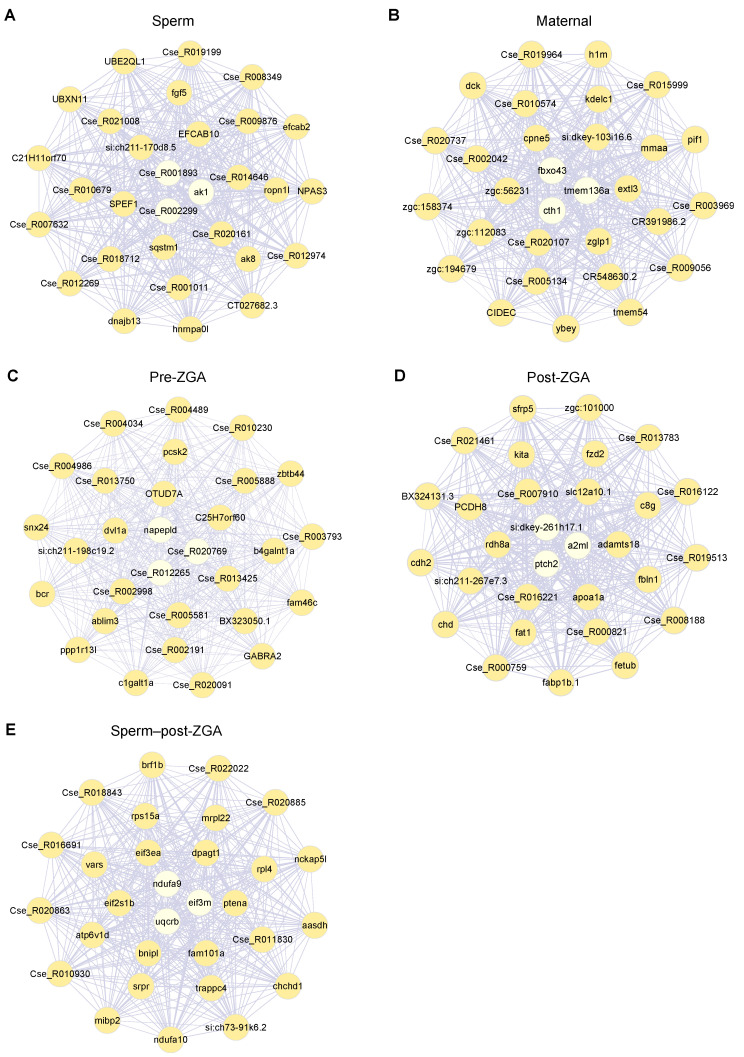
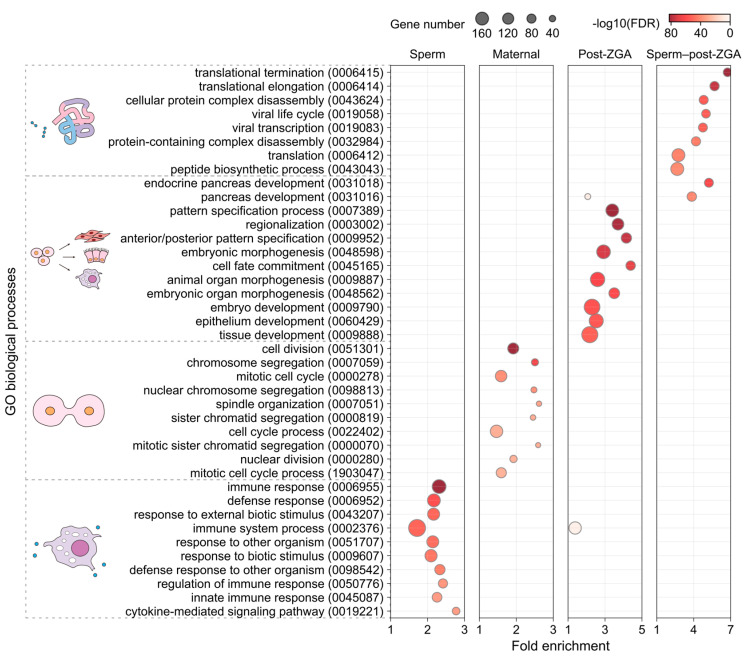
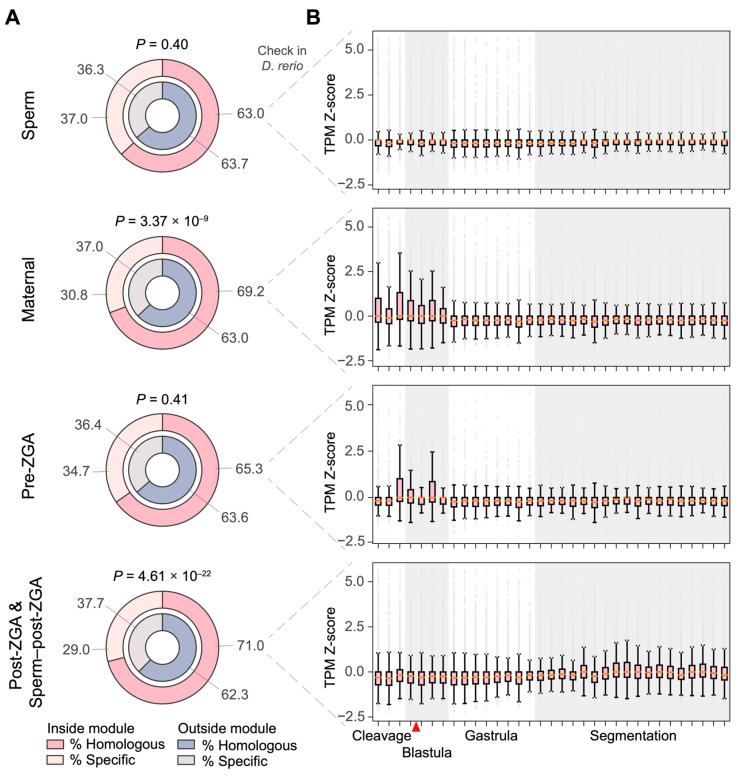
Commencing with sperm-egg fusion, the early stages of metazoan development include the cleavage and formation of blastula and gastrula. These early embryonic events play a crucial role in ontogeny and are accompanied by a dramatic remodeling of the gene network, particularly encompassing the maternal-to-zygotic transition. Nonetheless, the gene expression dynamics governing early embryogenesis remain unclear in most metazoan lineages. We conducted transcriptomic profiling on two types of gametes (oocytes and sperms) and early embryos (ranging from the four-cell to the gastrula stage) of an economically valuable flatfish-the Chinese tongue sole Cynoglossus semilaevis (Pleuronectiformes: Cynoglossidae). Comparative transcriptome analysis revealed that large-scale zygotic genome activation (ZGA) occurs in the blastula stage, aligning with previous findings in zebrafish. Through the comparison of the most abundant transcripts identified in each sample and the functional analysis of co-expression modules, we unveiled distinct functional enrichments across different gametes/developmental stages: actin- and immune-related functions in sperms; mitosis, transcription inhibition, and mitochondrial function in oocytes and in pre-ZGA embryos (four- to 1000-cell stage); and organ development in post-ZGA embryos (blastula and gastrula). These results provide insights into the intricate transcriptional regulation of early embryonic development in Cynoglossidae fish and expand our knowledge of developmental constraints in vertebrates.
Keywords: Cynoglossidae; Cynoglossus semilaevis; early embryonic development; gametes; transcriptomics.
Conflict of interest statement
Xinyi Cheng, Wei Jiang, Wei Dai, and Qiye Li are hired by BGI research.
Figures
Similar articles
-
Comparative transcriptome analysis explores maternal to zygotic transition during Eriocheir sinensis early embryogenesis.Gene. 2019 Feb 15;685:12-20. doi: 10.1016/j.gene.2018.10.036. Epub 2018 Oct 12. Gene. 2019. PMID: 30321661
-
Temporal Transcriptome Analysis Reveals Dynamic Expression Profiles of Gametes and Embryonic Development in Japanese Flounder (Paralichthys olivaceus).Genes (Basel). 2021 Sep 30;12(10):1561. doi: 10.3390/genes12101561. Genes (Basel). 2021. PMID: 34680958 Free PMC article.
-
Deep mRNA sequencing analysis to capture the transcriptome landscape of zebrafish embryos and larvae.PLoS One. 2013 May 20;8(5):e64058. doi: 10.1371/journal.pone.0064058. Print 2013. PLoS One. 2013. PMID: 23700457 Free PMC article.
-
Transcriptional Regulation During Zygotic Genome Activation in Zebrafish and Other Anamniote Embryos.Adv Genet. 2016;95:161-94. doi: 10.1016/bs.adgen.2016.05.001. Epub 2016 Jul 4. Adv Genet. 2016. PMID: 27503357 Review.
-
Role of oocyte-specific genes in the development of mammalian embryos.Reprod Med Biol. 2006 Aug 9;5(3):175-182. doi: 10.1111/j.1447-0578.2006.00139.x. eCollection 2006 Sep. Reprod Med Biol. 2006. PMID: 29662397 Free PMC article. Review.
References
Grants and funding
LinkOut - more resources
Full Text Sources
