The Role of Contrast-Enhanced Ultrasound in the Differential Diagnosis of Malignant and Benign Subpleural Lung Lesions
- PMID: 38673575
- PMCID: PMC11051455
- DOI: 10.3390/jcm13082302
The Role of Contrast-Enhanced Ultrasound in the Differential Diagnosis of Malignant and Benign Subpleural Lung Lesions
Abstract
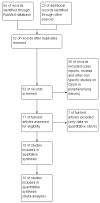
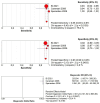
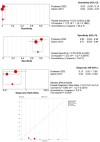
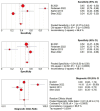
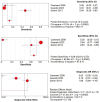
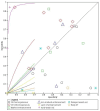
Background: The application of transthoracic contrast-enhanced ultrasound (CEUS) to the study of peripheral lung lesions is still a topic of debate. The main objective of this review was to evaluate the diagnostic accuracy of CEUS in the diagnosis of malignant subpleural pulmonary consolidations and, therefore, differentiate them from benign ones. Methods: Papers published before December 2023 were detected through a search of PubMed, Cochrane library, and Embase. The pooled specificity and sensitivity, summary receiver operating characteristic (SROC) curve and diagnostic odds ratio (DOR) were used. Results: CEUS is characterized by a pooled sensitivity of 0.95 (95% CI: 0.93-0.97) and a pooled specificity of 0.93 (95% CI: 0.90-0.95) in differentiating benign and malignant subpleural lung diseases; the AUC of SROC was 0.97. Homogeneous CE was characterized by a pooled sensitivity of 0.43 (95% CI: 0.40-0.45) and the pooled specificity of 0.49 (95% CI: 0.46-0.52). Non-homogeneous CE displayed a pooled sensitivity of 0.57 (95% CI: 0.55-0.60) and a pooled specificity of 0.51 (95% CI: 0.48-0.54). The lack of CE displayed a pooled sensitivity of 0.01 (95% CI: 0.00-0.06) and a pooled specificity of 0.76 (95% CI: 0.64-0.85). Marked CE displayed a pooled sensitivity of 0.41 (95% CI: 0.37-0.44) and a pooled specificity of 0.54 (95% CI: 0.50-0.58). Non-marked CE displayed a pooled sensitivity of 0.59 (95% CI: 0.56-0.63) and a pooled specificity of 0.46 (95% CI: 0.42-0.50). The early AT displayed a pooled sensitivity of 0.04 (95% CI: 0.02-0.08) and a pooled specificity of 0.83 (95% CI: 0.77-0.87). The early wash out displayed a pooled sensitivity of 0.61 (95% CI: 0.48-0.72) and a pooled specificity of 0.98 (95% CI: 0.92-1.00). The delayed wash out displayed a pooled sensitivity of 0.15 (95% CI: 0.10-0.20) and a pooled specificity of 0.69 (95% CI: 0.62-0.75). Conclusions: CEUS is characterized by excellent diagnostic accuracy for the diagnosis of the malignancy of subpleural lung lesions. By separately analyzing the CEUS findings, the diagnostic accuracy values are considerably lower and not significant in some cases. The simultaneous evaluation of multiple CEUS features allows us to reach an excellent diagnostic accuracy. Non-homogeneous CE with early wash out are the most indicative features of malignancy of a lung lesion.
Keywords: CEUS; consolidation; lung; malignant lesion; ultrasound.
Conflict of interest statement
The authors declare no conflicts of interest.
Figures







Similar articles
-
Contrast-Enhanced Ultrasound in Distinguishing between Malignant and Benign Peripheral Pulmonary Consolidations: The Debated Utility of the Contrast Enhancement Arrival Time.Diagnostics (Basel). 2023 Feb 10;13(4):666. doi: 10.3390/diagnostics13040666. Diagnostics (Basel). 2023. PMID: 36832153 Free PMC article.
-
Role of contrast-enhanced ultrasound for differentiation of benign vs. malignant portal vein thrombosis in hepatocellular carcinoma - A systematic review a meta-analysis.Australas J Ultrasound Med. 2023 Dec 10;27(1):56-64. doi: 10.1002/ajum.12375. eCollection 2024 Feb. Australas J Ultrasound Med. 2023. PMID: 38434544 Free PMC article.
-
Meta-analysis of contrast-enhanced ultrasound and contrast-enhanced harmonic endoscopic ultrasound for the diagnosis of gallbladder malignancy.BMC Med Inform Decis Mak. 2020 Sep 17;20(1):235. doi: 10.1186/s12911-020-01252-5. BMC Med Inform Decis Mak. 2020. Retraction in: BMC Med Inform Decis Mak. 2022 Jun 7;22(1):150. doi: 10.1186/s12911-022-01895-6. PMID: 32943025 Free PMC article. Retracted.
-
Diagnostic accuracy of contrast-enhanced ultrasound to differentiate benign and malignant breast lesions: A systematic review and meta-analysis.Eur J Radiol. 2022 Apr;149:110219. doi: 10.1016/j.ejrad.2022.110219. Epub 2022 Feb 15. Eur J Radiol. 2022. PMID: 35228171
-
Contrast-enhanced ultrasound for the differential diagnosis between benign and metastatic superficial lymph nodes: a meta-analysis.Cancer Manag Res. 2018 Oct 26;10:4987-4997. doi: 10.2147/CMAR.S174751. eCollection 2018. Cancer Manag Res. 2018. PMID: 30464599 Free PMC article. Review.
Cited by
-
Role of Quantitative CEUS in the Diagnosis of Peripheral Pulmonary Lesions: A Systematic Review.Cancers (Basel). 2025 May 18;17(10):1697. doi: 10.3390/cancers17101697. Cancers (Basel). 2025. PMID: 40427194 Free PMC article. Review.
-
Perfusion Patterns of Peripheral Pulmonary Metastasis Using Contrast-Enhanced Ultrasound (CEUS) and Their Correlation with Immunohistochemically Detected Vascularization Pattern.Cancers (Basel). 2024 Oct 1;16(19):3365. doi: 10.3390/cancers16193365. Cancers (Basel). 2024. PMID: 39409985 Free PMC article.
-
Comments and Illustrations of the European Federation of Societies for Ultrasound in Medicine (EFSUMB) Guidelines: Rare Malignant Pulmonal and Pleural Tumors: Primary Pulmonary Sarcoma and Mesothelioma, Imaging Features on Transthoracic Ultrasound.Diagnostics (Basel). 2024 Oct 21;14(20):2339. doi: 10.3390/diagnostics14202339. Diagnostics (Basel). 2024. PMID: 39451662 Free PMC article. Review.
References
Publication types
LinkOut - more resources
Full Text Sources

