. 2024 Apr 9;25(8):4149.
doi: 10.3390/ijms25084149.

Fine Mapping of Five Grain Size QTLs Which Affect Grain Yield and Quality in Rice

Affiliations

Fine Mapping of Five Grain Size QTLs Which Affect Grain Yield and Quality in Rice

Yin Zhou et al. Int J Mol Sci. .

Abstract

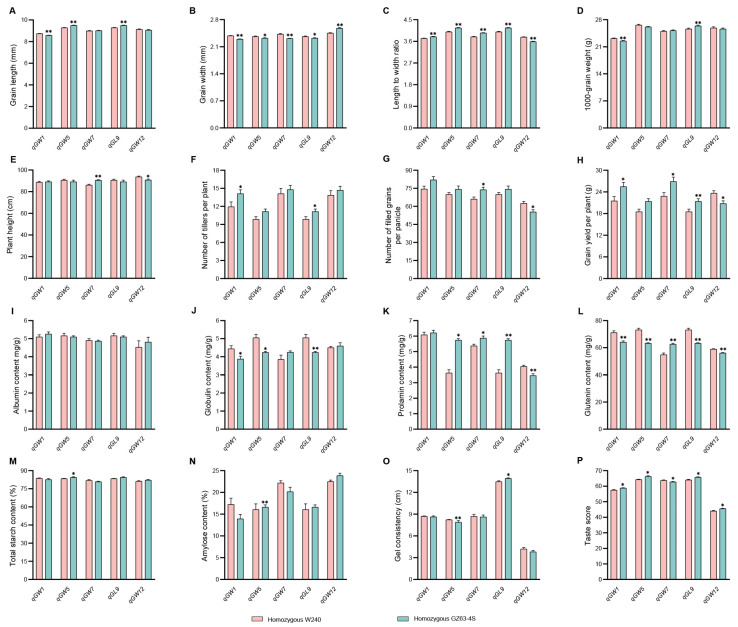
Grain size is a quantitative trait with a complex genetic mechanism, characterized by the combination of grain length (GL), grain width (GW), length to width ration (LWR), and grain thickness (GT). In this study, we conducted quantitative trait loci (QTL) analysis to investigate the genetic basis of grain size using BC1F2 and BC1F2:3 populations derived from two indica lines, Guangzhan 63-4S (GZ63-4S) and TGMS29 (core germplasm number W240). A total of twenty-four QTLs for grain size were identified, among which, three QTLs (qGW1, qGW7, and qGW12) controlling GL and two QTLs (qGW5 and qGL9) controlling GW were validated and subsequently fine mapped to regions ranging from 128 kb to 624 kb. Scanning electron microscopic (SEM) analysis and expression analysis revealed that qGW7 influences cell expansion, while qGL9 affects cell division. Conversely, qGW1, qGW5, and qGW12 promoted both cell division and expansion. Furthermore, negative correlations were observed between grain yield and quality for both qGW7 and qGW12. Nevertheless, qGW5 exhibited the potential to enhance quality without compromising yield. Importantly, we identified two promising QTLs, qGW1 and qGL9, which simultaneously improved both grain yield and quality. In summary, our results laid the foundation for cloning these five QTLs and provided valuable resources for breeding rice varieties with high yield and superior quality.

Keywords: QTL; grain size; quality; rice; yield.


Conflict of interest statement

The authors declare no conflicts of interest.

Figures

Figure 1
Figure 1
Frequency distributions of GL (A), GW (B), LWR (C), and GT (D) in the BC1F2 and BC1F2:3 populations. The vertical axis represents the number of BC1F2 and BC1F2:3 plants, with black and gray bars, respectively.
Figure 2
Figure 2
Genetic linkage map of grain-size-related QTLs detected in the BC1F2 and BC1F2:3 populations.
Figure 3
Figure 3
Analysis of qGW1 influence grain width. (A) Grain morphology. Scale bar: 5 mm. (B) Grain width difference among three haplotypes in 2020. (C) Fine mapping of qGW1. The numbers below the bar are physical distance (Mb). (D,E) Scanning electron microscopy of the outer epidermal cells of NIL-WqGW1 and NIL-GqGW1. Scale bar: 100 µm. (F) Cell length. (G) Total number of longitudinal cells. (H) Cell width. (I) Total number of transverse cells. (n = 10). (J) qRT-PCR analysis of four cell cycle related-genes and four cell expansion related-genes between NILs of qGW1. Data are represented as mean ± s.e.m. (n = 9). Duncan’s multiple range tests were used to conduct statistical analysis (a, b and c indicate p < 0.01). The student’s t-test was used to produce p values (*, ** indicate significance at p < 0.05 and p < 0.01, respectively).
Figure 4
Figure 4
Analysis of qGW5 influence grain length. (A) Grain morphology. Scale bar: 5 mm. (B) Grain length difference among three haplotypes in 2020. (C) Fine mapping of qGW5. The numbers below the bar are physical distance (Mb). (D,E) Scanning electron microscopy of the outer epidermal cells of NIL-WqGW5 and NIL-GqGW5. Scale bar: 100 µm. (F) Cell length. (G) Total number of longitudinal cells. (H) Cell width. (I) Total number of transverse cells. (n = 10). (J) qRT-PCR analysis of five cell cycle related-genes and four cell expansion related-genes between NILs of qGW5. Data are represented as mean ± s.e.m. (n = 9). Duncan’s multiple range tests were used to conduct statistical analysis (a, b and c indicate p < 0.01). The student’s t-test was used to produce p values (*, ** indicate significance at p < 0.05 and p < 0.01, respectively).
Figure 5
Figure 5
Analysis of qGW7 influence grain width. (A) Grain morphology. Scale bar: 5 mm. (B) Grain width difference among three haplotypes in 2020. (C) Fine mapping of qGW7. The numbers below the bar are physical distance (Mb). (D,E) Scanning electron microscopy of the outer epidermal cells of NIL-WqGW7 and NIL-GqGW7. Scale bar: 100 µm. (F) Cell length. (G) Total number of longitudinal cells. (H) Cell width. (I) Total number of transverse cells. (n = 10). (J) qRT-PCR analysis of six cell expansion related-genes between NILs of qGW7. Data are represented as mean ± s.e.m. (n = 9). Duncan’s multiple range tests were used to conduct statistical analysis (a, b and c indicate p < 0.01). The student’s t-test was used to produce p values (*, ** indicate significance at p < 0.05 and p < 0.01, respectively).
Figure 6
Figure 6
Analysis of qGL9 influence grain length. (A) Grain morphology. Scale bar: 5 mm. (B) Grain length difference among three haplotypes in 2020. (C) Fine mapping of qGL9. The numbers below the bar are physical distance (Mb). (D,E) Scanning electron microscopy of the outer epidermal cells of NIL-WqGL9 and NIL-GqGL9. Scale bar: 100 µm. (F) Cell length. (G) Total number of longitudinal cells. (H) Cell width. (I) Total number of transverse cells. (n = 10). (J) qRT-PCR analysis of fifteen cell cycle related-genes between NILs of qGL9. Data are represented as mean ± s.e.m. (n = 9). Duncan’s multiple range tests were used to conduct statistical analysis (a, b and c indicate p < 0.01). The student’s t-test was used to produce p values (*, ** indicate significance at p < 0.05 and p < 0.01, respectively).
Figure 7
Figure 7
Analysis of qGW12 influence grain width. (A) Grain morphology. Scale bar: 5 mm. (B) Grain width difference among three haplotypes in 2020. (C) Fine mapping of qGW12. The numbers below the bar are physical distance (Mb). (D,E) Scanning electron microscopy of the outer epidermal cells of NIL-WqGW12 and NIL-GqGW12. Scale bar: 100 µm. (F) Cell length. (G) Total number of longitudinal cells. (H) Cell width. (I) Total number of transverse cells. (n = 10). (J) qRT-PCR analysis of six cell cycle related-genes and three cell expansion related-genes between NILs of qGW12. Data are represented as mean ± s.e.m. (n = 9). Duncan’s multiple range tests were used to conduct statistical analysis (a and b indicate p < 0.01). The student’s t-test was used to produce p values (*, ** indicate significance at p < 0.05 and p < 0.01, respectively).
Figure 8
Figure 8
Phenotypes of rice yield and quality comparison among qGW1, qGW5, qGW7, qGL9, and qGW12 identified in this study. (AH) Grain length, grain width, length to width ratio, 1000-grain weight, plant height, number of tillers per plant, number of filled grains per panicle, and grain yield per plant in five NILs. (n = 12). (IP) Albumin content, globulin content, prolamin content, glutenin content, total starch content, amylose content, gel consistency, and taste score. (n = 6). All phenotypic data in (AP) were measured from paddy-grown NIL plants grown under normal cultivation conditions. Data are represented as mean ± s.e.m. The student’s t-test was used to produce p values (*, ** indicate significance at p < 0.05 and p < 0.01, respectively).
Figure 9
Figure 9
The differential expression analysis of (A,B) cell number and size genes.

Similar articles

Cited by

References

    1. International Rice Genome Sequencing Project. Sasaki T. The map-based sequence of the rice genome. Nature. 2005;436:793–800. doi: 10.1038/nature03895. - DOI - PubMed
    1. Xing Y., Zhang Q. Genetic and molecular bases of rice yield. Annu. Rev. Genet. 2010;61:421–442. doi: 10.1146/annurev-arplant-042809-112209. - DOI - PubMed
    1. Li N., Xu R., Duan P., Li Y. Control of grain size in rice. Plant Reprod. 2018;31:237–251. doi: 10.1007/s00497-018-0333-6. - DOI - PubMed
    1. Huang R., Jiang L., Zheng J., Wang T., Wang H., Huang Y., Hong Z. Genetic bases of rice grain shape: So many genes, so little known. Trends Plant Sci. 2013;18:218–226. doi: 10.1016/j.tplants.2012.11.001. - DOI - PubMed
    1. Zhao F., Zhang G., Yang Z., He G. Pyramiding QTL for yield-related traits and grain shape in rice using single-segment substitution lines. Indian J. Genet. Pl. Br. 2014;74:496–498. doi: 10.5958/0975-6906.2014.00875.X. - DOI

LinkOut - more resources