. 2024 Apr 10;25(8):4181.
doi: 10.3390/ijms25084181.

Deoxyxylulose 5-Phosphate Synthase Does Not Play a Major Role in Regulating the Methylerythritol 4-Phosphate Pathway in Poplar

Affiliations

Deoxyxylulose 5-Phosphate Synthase Does Not Play a Major Role in Regulating the Methylerythritol 4-Phosphate Pathway in Poplar

Diego González-Cabanelas et al. Int J Mol Sci. .

Abstract

The plastidic 2-C-methylerythritol 4-phosphate (MEP) pathway supplies the precursors of a large variety of essential plant isoprenoids, but its regulation is still not well understood. Using metabolic control analysis (MCA), we examined the first enzyme of this pathway, 1-deoxyxylulose 5-phosphate synthase (DXS), in multiple grey poplar (Populus × canescens) lines modified in their DXS activity. Single leaves were dynamically labeled with 13CO2 in an illuminated, climate-controlled gas exchange cuvette coupled to a proton transfer reaction mass spectrometer, and the carbon flux through the MEP pathway was calculated. Carbon was rapidly assimilated into MEP pathway intermediates and labeled both the isoprene released and the IDP+DMADP pool by up to 90%. DXS activity was increased by 25% in lines overexpressing the DXS gene and reduced by 50% in RNA interference lines, while the carbon flux in the MEP pathway was 25-35% greater in overexpressing lines and unchanged in RNA interference lines. Isoprene emission was also not altered in these different genetic backgrounds. By correlating absolute flux to DXS activity under different conditions of light and temperature, the flux control coefficient was found to be low. Among isoprenoid end products, isoprene itself was unchanged in DXS transgenic lines, but the levels of the chlorophylls and most carotenoids measured were 20-30% less in RNA interference lines than in overexpression lines. Our data thus demonstrate that DXS in the isoprene-emitting grey poplar plays only a minor part in controlling flux through the MEP pathway.

Keywords: DMADP; DXS enzyme; IDP; MEP pathway; flux control coefficient (FCC); isoprene; isoprenoid; metabolic control analysis (MCA).


Conflict of interest statement

The authors declare no conflict of interest.

Figures
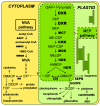
Figure 1
Figure 1
Scheme of the two isoprenoid biosynthesis pathways in the plant cell (modified after Rodriguez-Concepcion (2006) [14]). The MEP pathway is depicted in the bright green box inside the plastid. Dashed arrows indicate multiple steps. The question mark indicates that the extent of IDP+DMADP exchange between compartments is uncertain. MVA, mevalonic acid; AACT, acetoacetyl CoA thiolase; HMGS, hydroxymethylglutaryl (HMG) CoA synthase; HMGR, HMG-CoA reductase; IDP, isopentenyl diphosphate; DMADP, dimethylallyl diphosphate; IDI, IDP isomerase; GAP, glyceraldehyde phosphate; MEP, methylerythritol phosphate; DXP, deoxyxylulose phosphate; DXS, DXP synthase; DXR, DXP reductoisomerase; MCT, MEP cytidylyltransferase; ME-CDP, cytidine diphosphomethylerythritol; CMK, ME-CDP kinase; MEP-CDP, ME-CDP phosphate; MEcDP, methylerythritol cyclodiphosphate; MDS, MEcDP synthase; HMBDP, hydroxymethylbutenyl diphosphate; HDS, HMBDP synthase; HDR, HMBDP reductase; ISPS, isoprene synthase; GGDP, geranylgeranyl diphosphate; GGDPS, GGDP synthase; FDP, farnesyl diphosphate; ABA, abscisic acid.
Figure 2
Figure 2
Effect of varying light and temperature conditions on isoprene emission in wild-type grey poplar under 1000 or 250 µmol m−2 s−1 of incident photosynthetically-active quantum flux density (PPFD) and a temperature of 30 °C or 21 °C and 380 µL L−1 CO2. Emission of isoprene was normalized to the leaf area. Means of n = 5 ± SE are shown. Significance differences (one-way ANOVA followed by Tukey’s test) at p < 0.05 are indicated with different letters.
Figure 3
Figure 3
Dynamics of 13C incorporation into isoprene in WT P. × canescens leaves under one set of environmental conditions, 1000 PPFD and 30 °C. Leaves were fed for 50 min with 380 µL L−1 13CO2, 99.9%. 13C labeling began at 0 min. The isotopologue masses of isoprene are shown using different colors, representing the incorporation of different numbers of 13C-labeled carbon atoms: red, 13C0; purple, 13C1; blue, 13C2; green, 13C3; yellow, 13C4; orange, 13C5. The dashed black line represents the overall 13C labeling incorporation over the time.
Figure 4
Figure 4
Incorporation of 13C into IDP+DMADP (orange) and isoprene (light red) in WT P. × canescens leaves after feeding them for 50 min with 380 µL L−1 13CO2, 99.9%, under different conditions of light (1000 or 250 PPFD) and temperature (30 or 21 °C). Shown are means (±SE) of five biological replicates.
Figure 5
Figure 5
Transcript levels of grey poplar PcDXS1 and PcDXS2 genes at midday in transgenic silenced (iRNA-DXS1-2, iRNA-DXS1-3, iRNA-DXS1-4), and overexpression (DXS1+-5, DXS1+-6, DXS1+-14, DXS1+-15) lines compared with wild-type (WT) and empty vector (pCam) controls. Leaves were subjected to 250 µmol m−2 s−1 of incident PPFD, 21 °C leaf temperature and 380 µmol mol−1 of CO2 for 50 min before taking samples. Relative quantification was performed according to the efficiency corrected model [77]. Efficiencies were obtained from the slope of dilution curves using control cDNA diluted from 1 to 1024 times at 4× intervals. Target gene expression was normalized to PcActin2 and fold-change values for each gene were calculated by comparison with the mean expression of the same gene in wild-type control plants (dark blue). Error bars indicate the SE of three biological replicates (n = 3) analyzed in triplicate SYBR green assays. Significance differences (one-way ANOVA followed by Tukey’s test) at p < 0.05 are indicated with different letters.
Figure 6
Figure 6
In vitro grey poplar DXS activity in PcDXS1 transgenic silenced (green) and overexpression (blue) lines compared to empty vector control (red) lines. Activity was measured in vitro in protein extracts obtained from leaves grown under different conditions of light (1000 or 250 PPFD) and temperature (30 or 21 °C). The quantity of DXP produced was determined using an external standard curve and normalized to an internal standard of [13C5]DXP. Boxplots show medians, quartiles, and outliers. The sample size of each box is given in Table 1. Boxes are filled according the different environmental conditions tested. Significance differences (two-way ANOVA followed by Tukey’s test) at p < 0.05 are indicated with different letters. EC, environmental conditions; TL, transgenic lines.
Figure 7
Figure 7
Isoprene emission of grey poplar from transgenic DXS1-silenced (iRNA-DXS1) and overexpression (DXS1+) lines compared to empty vector controls (Control), under different conditions of light (1000 or 250 PPFD) and temperature (30 or 21 °C). Boxplots show medians, quartiles, and outliers. T sample size of each box is given in Table 1. Significance differences (GLS model comparison after sequential factor removal) at p < 0.05 are indicated with different letters. EC, environmental conditions; TL, transgenic lines.
Figure 8
Figure 8
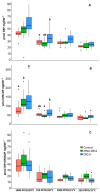
Pool sizes of (A) DXP, (B) MEcDP, and (C) IDP+DMADP in transgenic DXS1-silenced (RNAi-DXS1) and overexpression (DXS1+) lines compared to empty vector controls (Control) under different conditions of light (1000 or 250 PPFD) and temperature (30 or 21 °C). The concentrations of DXP, MEcDP and IDP+DMADP were determined using an external standard curve and normalized to internal unlabeled standards. Boxplots show medians, quartiles, and outliers. The sample size of each box is given in Table 1. Significance differences (one-way ANOVA followed by Tukey’s test with correction for multiple testing following Holm [78]) at p < 0.05 are indicated with different letters.
Figure 9
Figure 9
MEP pathway carbon flux in transgenic DXS1-silenced (iRNA-DXS1) and overexpression (DXS1+) lines under different conditions of light (1000 or 250 PPFD) and temperature (30 or 21 °C). Boxplots show medians, quartiles, and outliers. Sample size of each box is given in Table 1. Significant differences (two-way ANOVA followed by Tukey’s test) at p < 0.05 are indicated with different letters. EC, environmental conditions; TL, transgenic lines.
Figure 10
Figure 10
Content of carotenoids and chlorophylls in transgenic DXS1-silenced (iRNA-DXS1) and overexpression (DXS1+) lines. Leaves were acclimated under steady-state conditions (incident PPFD of 250 µmol m−2 s−2, leaf temperature 21 °C, and CO2 concentration of 380 µmol mol−1) before harvesting. Boxplots show medians, quartiles, and outliers. Sample sizes are given in Table 1. Significance differences between lines were tested with one-way ANOVA (Tukey’s test) at p < 0.05 and are indicated with different letters. ß-Car, ß-carotene; Lut, lutein; Nx, neoxanthin; Vx, violaxanthin; Chl-a, chlorophyll a; Chl-b, chlorophyll b.

Similar articles

References

    1. Gershenzon J., Dudareva N. The function of terpene natural products in the natural world. Nat. Chem. Biol. 2007;3:408–414. doi: 10.1038/nchembio.2007.5. - DOI - PubMed
    1. Croteau R., Kutchan T.M., Lewis N.G. Natural Products (Secondary Metabolites) Biochem. Mol. Biol. Plants. 2000;24:1250–1319.
    1. Croteau R. Biosynthesis and Catabolism of Monoterpenoids. Chem. Rev. 1987;87:929–954. doi: 10.1021/cr00081a004. - DOI
    1. Eisenreich W., Schwarz M., Cartayrade A., Arigoni D., Zenk M.H., Bacher A. The deoxyxylulose phosphate pathway of terpenoid biosynthesis in plants and microorganisms. Chem. Biol. 1998;5:R22–R233. doi: 10.1016/S1074-5521(98)90002-3. - DOI - PubMed
    1. Rohmer M., Knani M., Simonin P., Sutter B., Sahm H. Isoprenoid biosynthesis in bacteria: A novel pathway for the early steps leading to isopentenyl diphosphate. Pt 2Biochem. J. 1993;295:517–524. doi: 10.1042/bj2950517. - DOI - PMC - PubMed

LinkOut - more resources