. 2024 Apr 11;25(8):4222.
doi: 10.3390/ijms25084222.

Cellular Imaging and Time-Domain FLIM Studies of Meso-Tetraphenylporphine Disulfonate as a Photosensitising Agent in 2D and 3D Models

Affiliations

Cellular Imaging and Time-Domain FLIM Studies of Meso-Tetraphenylporphine Disulfonate as a Photosensitising Agent in 2D and 3D Models

Andrea Balukova et al. Int J Mol Sci. .

Abstract

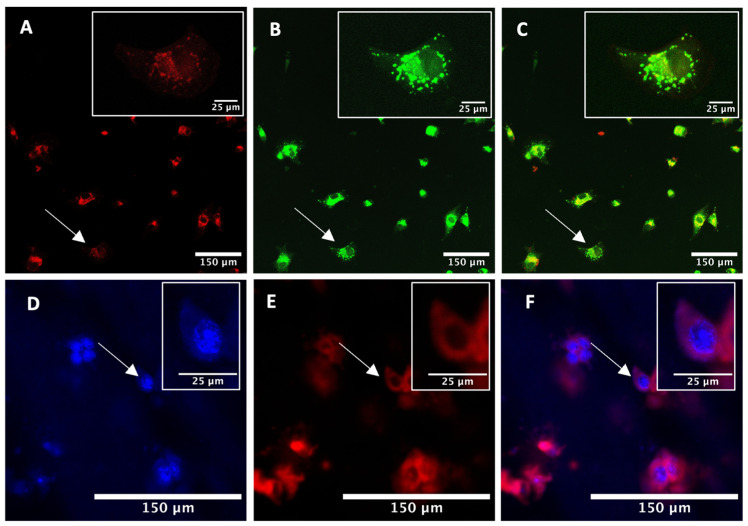
Fluorescence lifetime imaging (FLIM) and confocal fluorescence studies of a porphyrin-based photosensitiser (meso-tetraphenylporphine disulfonate: TPPS2a) were evaluated in 2D monolayer cultures and 3D compressed collagen constructs of a human ovarian cancer cell line (HEY). TPPS2a is known to be an effective model photosensitiser for both Photodynamic Therapy (PDT) and Photochemical Internalisation (PCI). This microspectrofluorimetric study aimed firstly to investigate the uptake and subcellular localisation of TPPS2a, and evaluate the photo-oxidative mechanism using reactive oxygen species (ROS) and lipid peroxidation probes combined with appropriate ROS scavengers. Light-induced intracellular redistribution of TPPS2a was observed, consistent with rupture of endolysosomes where the porphyrin localises. Using the same range of light doses, time-lapse confocal imaging permitted observation of PDT-induced generation of ROS in both 2D and 3D cancer models using fluorescence-based ROS together with specific ROS inhibitors. In addition, the use of red light excitation of the photosensitiser to minimise auto-oxidation of the probes was investigated. In the second part of the study, the photophysical properties of TPPS2a in cells were studied using a time-domain FLIM system with time-correlated single photon counting detection. Owing to the high sensitivity and spatial resolution of this system, we acquired FLIM images that enabled the fluorescence lifetime determination of the porphyrin within the endolysosomal vesicles. Changes in the lifetime dynamics upon prolonged illumination were revealed as the vesicles degraded within the cells.

Keywords: fluorescence lifetime imaging microscopy; photodynamic therapy; reactive oxygen species.


Conflict of interest statement

The authors declare no conflict of interest.

Figures

Figure 1
Figure 1
Confocal images of HEY cells in 2D monolayer models (AC) and 3D construct models (DF). (AC): Cells were co-treated with 1 μM porphyrin TPPS2a for 24 h and 100 nM Lysotracker Green. (A) TPPS2a fluorescence using 405 nm excitation; (B) Lysotracker Green fluorescence using 488 nm excitation; (C) represents an overlay image of (A,B). The scale bar presented in each image is 50 μm. (DF): 3D constructs were treated with 1 μM porphyrin TPPS2a for 24 h. Prior to imaging, the constructs were stained with 10 μM DAPI (blue) and incubated for 30 min. The porphyrin TPPS2a (E) was imaged in the same manner as in the 2D model, and (F) is an overlay of (D,E). The scale bar presented in each image is 150 μm. Scale bar for the magnified images in insets highlighted by arrows is 25 μm.
Figure 2
Figure 2
Time-lapse confocal imaging of HEY 2D monolayer culture. Cells were treated with 2 μM TPPS2a for 24 h prior to imaging. Cells were initially illuminated on-stage using the 405 nm laser at a low power setting (10%) and an image recorded (A), then the laser power was increased to 80%, and images were taken at 1 min (B), 3 min (C), and 5 min illumination (D). The inset in the top right corner shows an expanded view of the cell highlighted by the arrow to demonstrate intracellular fluorescence redistribution. The scale bar presented in each image is 150 μm. Scale bar for the magnified images in insets is 50 μm.
Figure 3
Figure 3
Detection of reactive oxygen species using DCFH-DA assay in 2D monolayers. (AC): HEY cells were incubated with 1 μM TPPS2a for 22 h. Prior to imaging, 5 μM DCFH-DA was added for 2 h to the cells. (A) DCFH-DA fluorescence before illumination; (B) TPPS2a fluorescence; (C) DCFH-DA fluorescence after 5 min light exposure. TPPS2a images are shown in red, fluorescein in false colour (blue, low; green, high). (DF): HEY cells incubated with 5 μM DCFH-DA for 2 h (without TPPS2a). (D) DCFH-DA fluorescence before illumination; (E) control image showing no TPPS2a fluorescence; (F) DCFH-DA fluorescence after 5 min illumination. The scale bar presented in each image is 150 μm.
Figure 4
Figure 4
Detection of reactive oxygen species using DCFH-DA assay in 3D spheroid constructs. (AC). TPPS2a images are shown in red, fluorescein in false colour. HEY cells were incubated with 1 μM TPPS2a for 22 h. Prior to imaging, 5 μM DCFH-DA was added into the cells. (A) DCFH-DA fluorescence before 405 nm illumination; (B) TPPS2a fluorescence; (C) DCFH-DA fluorescence after illumination. (DF): HEY cells incubated with 5 μM DCFH-DA (without TPPS2a). (D) DCFH-DA fluorescence before illumination; (E) control image showing no TPPS2a fluorescence; (F) DCFH-DA fluorescence after illumination. The scale bar presented in each image is 150 μm.
Figure 5
Figure 5
Detection of reactive oxygen species using Sensor Green (SG) following 405 nm illumination. Cells were treated with 1 μM TPPS2a and incubated for 22 h prior to imaging. For the detection experiment, 10 μM SG was added to the cells for a further 2 h prior to imaging, and for the inhibition experiment, 10 μM SG and 25 mM NaN3 were added for 2 h prior to imaging. (A) SG fluorescence before on-stage illumination; (B) TPPS2a fluorescence; (C) SG fluorescence after illumination. TPPS2a images are shown in red, fluorescein in false colour (blue, low; green, high). (DF): Control sample treated with only SG showing SG fluorescence (D,F) after illumination using 405 nm laser with no TPPS2a present (E). (GI): Inhibition of singlet oxygen in co-treated (SG + TPPS2a + NaN3) sample, where SG (G,I) and TPPS2a (H) were detected as described above. The scale bar presented in each image is 50 μm.
Figure 6
Figure 6
Detection of reactive oxygen species using Sensor Green (SG) in 3D spheroid constructs. Cells were treated with 2 μM TPPS2a and then incubated for 22 h prior to imaging. For the ROS detection experiment, Sensor Green (SG) was added to the cells for a further 2 h prior to imaging, and for the inhibition experiment, Sensor Green and 50 mM NaN3 were added for 2 h prior to imaging. (AC): Detection of singlet oxygen in co-treated (SG + TPPS2a) showing SG fluorescence (A) and TPPS2a fluorescence (B) prior to 405 nm illumination, (C) following 405 nm illumination; (DF): Control sample treated with only SG showing SG fluorescence (D,F) after 405 nm illumination and with no TPPS2a present (E). (GI): Inhibition of singlet oxygen in co-treated (SG + TPPS2a + NaN3) sample, where SG (G,I) and TPPS2a (H) were detected as described above. The scale bar presented in each image is 150 μm. Scale bar for the magnified images highlighted by arrows in insets is 25 μm.
Figure 7
Figure 7
Detection of reactive oxygen species in 3D spheroid constructs using DHE. (AC): Cells were incubated with 1 μM TPPS2a for 22 h and 1 μM DHE for a further 2 h, showing DHE fluorescence (A) prior to on-stage 405 nm illumination, (B) following 638 nm illumination, and TPPS2a fluorescence (C). (DF): Control images where cells were incubated with only 1 μM DHE and 200 units SOD-PEG for 2 h without TPPS2a. (GI): Cells were incubated with 1 μM TPPS2a for 20 h, 1 μM DE for a further 2 h, washed, and then 200 units SOD-PEG was added for a further 2 h prior to imaging. The scale bar presented in each image is 150 μm.
Figure 8
Figure 8
FLIM images of HEY cells in 2D model incubated with 4 μM TPPS2a for 24 h. The top panel shows imaging and lifetime data for initial image recorded. The bottom panel shows the corresponding figures following prolonged on-stage illumination. (A) Intensity images; (B) FLIM images of cells. Average lifetime determined by mono-exponential fitting is colour-coded onto the intensity image, as shown in the colour bar. (C) Bi-exponential fit of all pixels >200 photon counts combined. Arrow highlights a group of punctate vesicles before and after prolonged illumination. The scale bar at bottom left corresponds to 10 μm.
Figure 9
Figure 9
FLIM image of HEY cells in 2D model incubated with 6 μM TPPS2a for 24 h. (A) Intensity image; (B) fractional contribution (f2) of the short lifetime component determined by global fitting. Global lifetimes detected: 12.9 ns and 2.61 ns. Colour bar shows the scale for the fractional contribution. The scale bar at bottom left corresponds to 10 μm.
Figure 10
Figure 10
Time-resolved NIR detection of singlet oxygen in 3D spheroid constructs. (A) Without addition of azide shown with computed lifetime fit (50 μs) and residuals; (B) with addition of azide (0.5 mM) shown with computed lifetime fit and residuals. Initial short-lived signal is from NIR tail of fluorescence. In the presence of azide, which is a physical quencher of singlet oxygen, the long-lived NIR phosphorescence tail is suppressed. The insets in the top right corners show the ‘X’ chi-squared values for the fitting.

Similar articles

References

    1. Dolmans D.E.J.G.J., Fukumura D., Jain R.K. Photodynamic therapy for cancer. Nat. Rev. Cancer. 2003;3:380–387. doi: 10.1038/nrc1071. - DOI - PubMed
    1. Brown S.B., Brown E.A., Walker I. The present and future role of photodynamic therapy in cancer treatment. Lancet Oncol. 2004;5:497–508. doi: 10.1016/S1470-2045(04)01529-3. - DOI - PubMed
    1. Agostinis P., Berg K., Cengel K.A., Foster T.H., Girotti A.W., Gollnick S.O., Hahn S.M., Hamblin M.R., Juzeniene A., Kessel D., et al. Photodynamic therapy of cancer: An update. CA Cancer J. Clin. 2011;61:250–281. doi: 10.3322/caac.20114. - DOI - PMC - PubMed
    1. van Straten D., Mashayekhi V., de Bruijn H., Oliveira S., Robinson D. Oncologic Photodynamic Therapy: Basic Principles, Current Clinical Status and Future Directions. Cancers. 2017;9:19. doi: 10.3390/cancers9020019. - DOI - PMC - PubMed
    1. Dos Santos A.F., De Almeida D.R.Q., Terra L.F., Baptista M.S., Labriola L. Photodynamic therapy in cancer treatment—An update review. J. Cancer Metastasis Treat. 2019;5:25. doi: 10.20517/2394-4722.2018.83. - DOI

LinkOut - more resources