. 2024 Apr 11;25(8):4254.
doi: 10.3390/ijms25084254.

Intraphagosomal Free Ca2+ Changes during Phagocytosis

Affiliations

Intraphagosomal Free Ca2+ Changes during Phagocytosis

Sharon Dewitt et al. Int J Mol Sci. .

Abstract

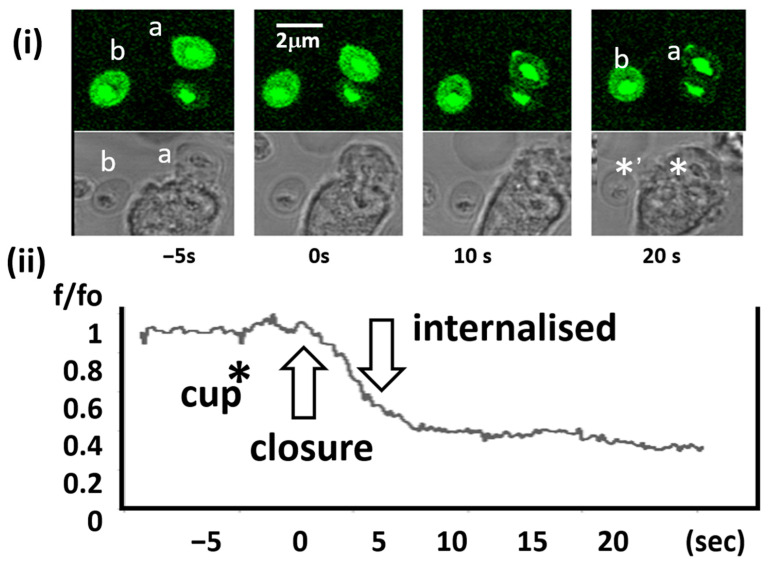
Phagocytosis (and endocytosis) is an unusual cellular process that results in the formation of a novel subcellular organelle, the phagosome. This phagosome contains not only the internalised target of phagocytosis but also the external medium, creating a new border between extracellular and intracellular environments. The boundary at the plasma membrane is, of course, tightly controlled and exploited in ionic cell signalling events. Although there has been much work on the control of phagocytosis by ions, notably, Ca2+ ions influxing across the plasma membrane, increasing our understanding of the mechanism enormously, very little work has been done exploring the phagosome/cytosol boundary. In this paper, we explored the changes in the intra-phagosomal Ca2+ ion content that occur during phagocytosis and phagosome formation in human neutrophils. Measuring Ca2+ ion concentration in the phagosome is potentially prone to artefacts as the intra-phagosomal environment experiences changes in pH and oxidation. However, by excluding such artefacts, we conclude that there are open Ca2+ channels on the phagosome that allow Ca2+ ions to "drain" into the surrounding cytosol. This conclusion was confirmed by monitoring the translocation of the intracellularly expressed YFP-tagged C2 domain of PKC-γ. This approach marked regions of membrane at which Ca2+ influx occurred, the earliest being the phagocytic cup, and then the whole cell. This paper therefore presents data that have novel implications for understanding phagocytic Ca2+ signalling events, such as peri-phagosomal Ca2+ hotspots, and other phenomena.

Keywords: Ca2+ channels; intra-phagosomal Ca2+; neutrophil; phagocytosis; phagosome.


Conflict of interest statement

The authors declare no conflict of interest.

Figures

Figure 1
Figure 1
Properties of fluo4-zymosan particles. (a) The phase contrast (upper) and fluorescent (lower) appearance of zymosan particles in 1.3 mM Ca2+, with the dense “core” and the transparent periphery indicated. (b) The relationship between free Ca2+ concentration and fluorescence intensity from the core and peripheral regions of individual zymosan particles. Individual experimental data are shown as F/Fmax (with separate symbols), together with the theoretical relationship (lines) shown for two dissociation constants (kd). (c) A sample experiment showing the same microscopic field; top = phase contrast; then florescence images in the same field at the Ca2+ concentrations indicated.
Figure 2
Figure 2
Comparison of fluorescein and fluo4-coupled zymosan particles. In (a,b), the phase contrast and corresponding fluorescent images are shown for (a) fluo4-coupled zymosan and (b) fluorescein-coupled zymosan. Both sets of images show the internalised particles, marked by a “+” and external particles by a “*”. (c) The quantitation of fluorescence from fluo4 and fluorescein particles either outside the cell (ZO) or inside a phagosome (Zph). The fluorescence units were arbitrary but were comparable, as measurements were taken from the same microscopic fields with the same excitation strength and detection sensitivity. The bars show the mean and the vertical line shows the range for at least 50 determinations.
Figure 3
Figure 3
The effect of experimental manipulations on fluo4-zymosan fluorescence. (a) The effect of H2O2 on fluo4-zymosan fluorescence incubated for the lengths of time shown. The top panel shows a typical experiment and the graph below shows the combined data from 3 separate experiments (n = 100 particles). The bars show the S.E.M. for the 3 experiments. (b) A typical experiment demonstrating the effect of acidification on fluo4-zymosan-fluorescence at the pH shown. In repeat experiments, fluo4 intensity in the zymosan periphery was reduced by 8.5 ± 0.7% and the core increased by 2.2 ± 1.9% when the pH was reduced from 7.5 to 5.5 (mean ± sem., n = 25). (c) The intensity of fluo4-zymosan within the phagosome (open bars) and after treatment (cross-hatched bars). The pair marked “TX” is before and after TritonX-100 (0.1%) treatment; the pair marked “Sap” is before and after saponin (10% w/v) treatment; the pair marked “Iono” is for the same zymosan particles before and after the addition of ionomycin (1 μM). In each case, the bars show the mean and the vertical lines the range of replicate experiments for 5 experiments. (d) The time course of the change in fluo4-zymosan intensity after the addition of ionomycin, with the asterisk indicating the time point at which ionomycin was added and the images above the same cell depicting two fluo4-zymosan particles before and after ionomycin treatment. The scales bars on each image represents 2 μm.
Figure 4
Figure 4
Changes in fluo4-zymosan intensity during phagocytosis. (i) Fluorescence and phase contrast images of the time sequence of a neutrophil as it internalises a zymosan particle. The particle that is internalised is labelled (a) and (b) is the “control” particle, which remains external. Each image shows the progress of phagocytosis at the times indicated. The location of particles a.b are indicated on the phase contrast image as * and *’ respectively. (ii) The lower graph shows the complete time sequence of the decrease in fluo4-zymosan intensity with key events (cup formation, closure of the phagosome, and internalisation) marked. The sequence is typical of at least 14 other phagocytotic events. The movie in the Supplementary Materials (Movie S1) shows a different experiment, in which a similar complete process of phagocytosis and the accompanying decrease in fluo4-zymosan fluorescence can be seen.
Figure 5
Figure 5
Sites of Ca2+ influx marked by YFP-tagged C2 domain of PKC-γ. (a) A sequence of images of a RAW 264.7 cell expressing YFP–C2-γ. The phagocytic target is indicated by the crosshatched circle. At time zero (as indicated), a phagocytic cup formed at the base of the zymosan without translocation of YFP–C2-γ from the cytosol. After 1 s, translocation of YFP–C2-γ from the cytosol to the plasma membrane of the phagocytic cup is seen. This is also shown in the enlarged image (b). At 2 s, translocation of YFP–C2-γ to the phagocytic cup and the rest of the plasma membrane is obvious, as can also be seen in the image marked “3 s”. (b) Enlarged images showing a previous old phagosome marked by an “X”, which has no translocated YFP–C2-γ on its membrane at 1 s, but in the lower image at 2 s, some translation had occurred. In image (c) at 20 s, translocation of YFP–C2-γ had remained globally on the plasma membrane and can also be seen more clearly on the previously internalised phagosome. (d) The time course of the relative intensity changes measured at time t (It) as a fraction of the intensity at time zero (I0), measured within the measurements zones indicated at the plasma membrane (PM) and cytosol (within the box) indicated in (e).
Figure 6
Figure 6
Proposed sequence of Ca2+ channel opening on the phagosomal membrane. (a) A “cartoon” of some of the components of the proposed model system. The phagocyte plasma membrane with Ca2+ ion channels (closed) before contact with the phagocytic target (zymosan particle) and Ca2+ ions is labelled. (b) The proposed sequence of events during phagocytosis are shown as follows. (i) Before contact between the phagocyte and the target, where the cytosolic free Ca2+ ion concentration is low. (ii) Contact between the particle and the phagocyte, resulting in the formation of a phagocytic cup, with the Ca2+ ion channels remaining closed and the cytosolic free Ca2+ ion concentration still low. (iii) A critical number of receptors are engaged, the Ca2+ channels remain open, and the cytosolic free Ca2+ ion concentration begins to rise. Note that the location of the open Ca2+ channels includes the portion of plasma membrane that forms the base of the forming phagosome and thus provides a mechanism for preferentially elevating Ca2+ near the forming phagosome. (iv) In response to the elevated cytosolic free Ca2+ ion concentration, the pseudopodia around the target nearly enclose it, trapping Ca2+ ions in the forming phagosome. (v) Phagocytosis is complete but Ca2+ channels remain open on the phagosomal membrane, such that intra-phagosomal Ca2+ leaks out into the surrounding cytosol. Once “drained” of Ca2+, the phagosome plays no further role in Ca2+ signalling.

Similar articles

References

    1. Dewitt S., Hallett M.B. Cytosolic free Ca2+ changes and calpain activation are required for beta integrin-accelerated phagocytosis by human neutrophils. J. Cell Biol. 2002;159:181–189. doi: 10.1083/jcb.200206089. - DOI - PMC - PubMed
    1. Nunes P., Demaurex N. The role of calcium signaling in phagocytosis. J. Leuk. Biol. 2010;88:57–68. doi: 10.1189/jlb.0110028. - DOI - PubMed
    1. Francis E.A., Heinrich V. Single-cell investigation of the role of calcium bursts in human immune cells. Biophys. J. 2017;112:400A. doi: 10.1016/j.bpj.2016.11.2168. - DOI - PMC - PubMed
    1. Jaumouillé V., Grinstein S. Molecular Mechanisms of Phagosome Formation. Microbiol. Spectr. 2016;4 doi: 10.1128/microbiolspec.MCHD-0013-2015. - DOI - PubMed
    1. Uribe-Querol E., Rosales C. Phagocytosis: Our current understanding of a universal biological process. Front. Immunol. 2020;11:1066. doi: 10.3389/fimmu.2020.01066. - DOI - PMC - PubMed

LinkOut - more resources