

Renal Endothelial Single-Cell Transcriptomics Reveals Spatiotemporal Regulation and Divergent Roles of Differential Gene Transcription and Alternative Splicing in Murine Diabetic Nephropathy
- PMID: 38673910
- PMCID: PMC11050020
- DOI: 10.3390/ijms25084320
Renal Endothelial Single-Cell Transcriptomics Reveals Spatiotemporal Regulation and Divergent Roles of Differential Gene Transcription and Alternative Splicing in Murine Diabetic Nephropathy
Abstract
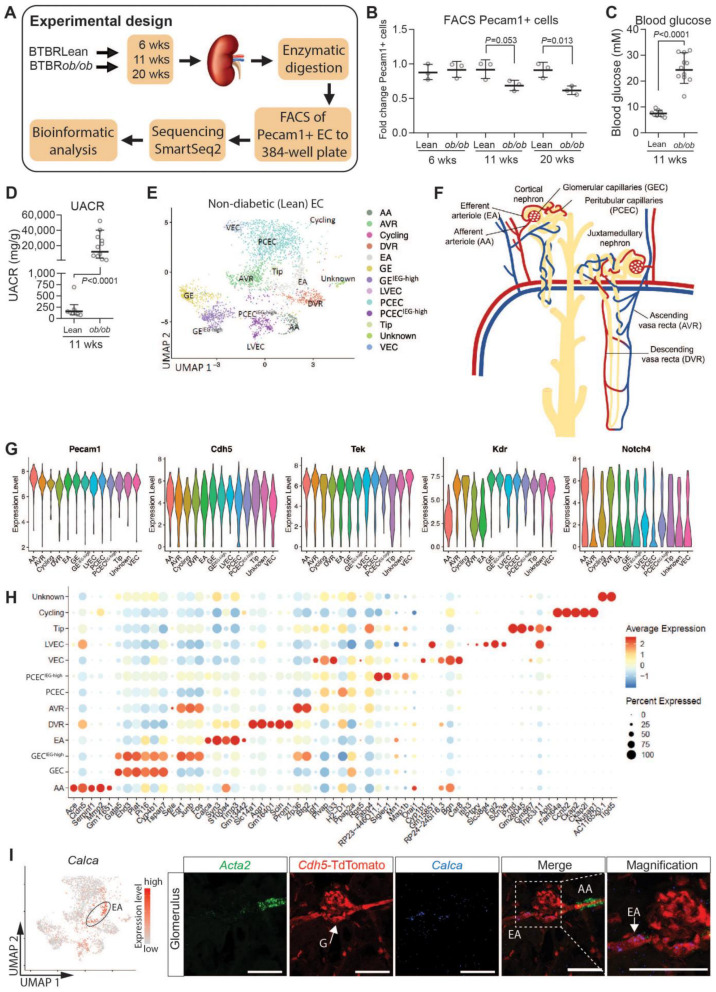
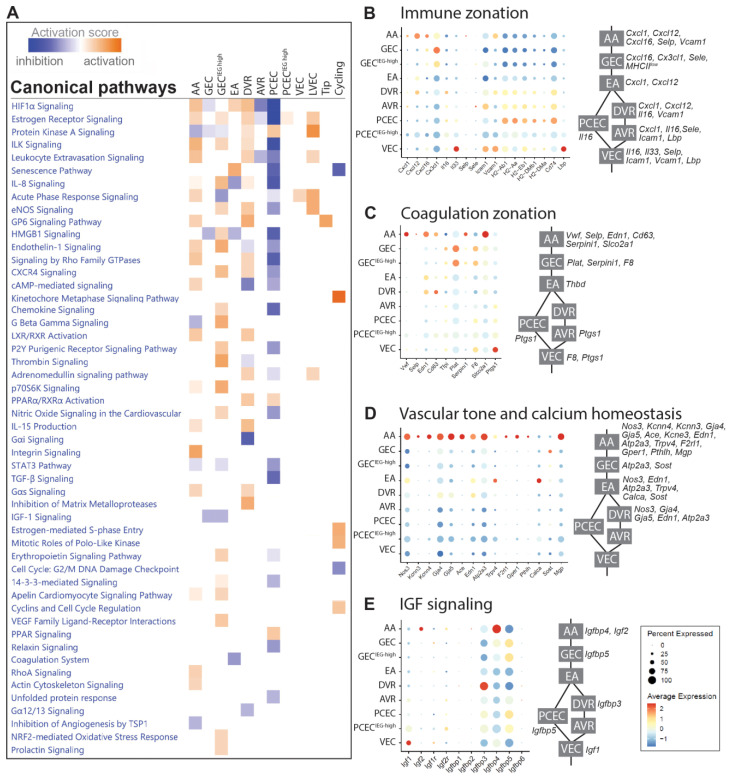
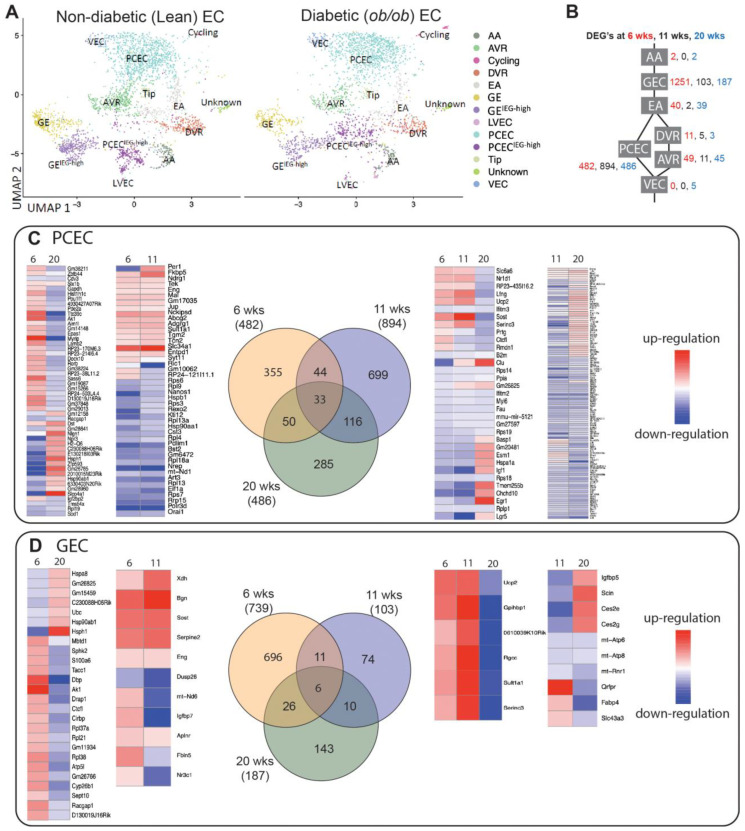
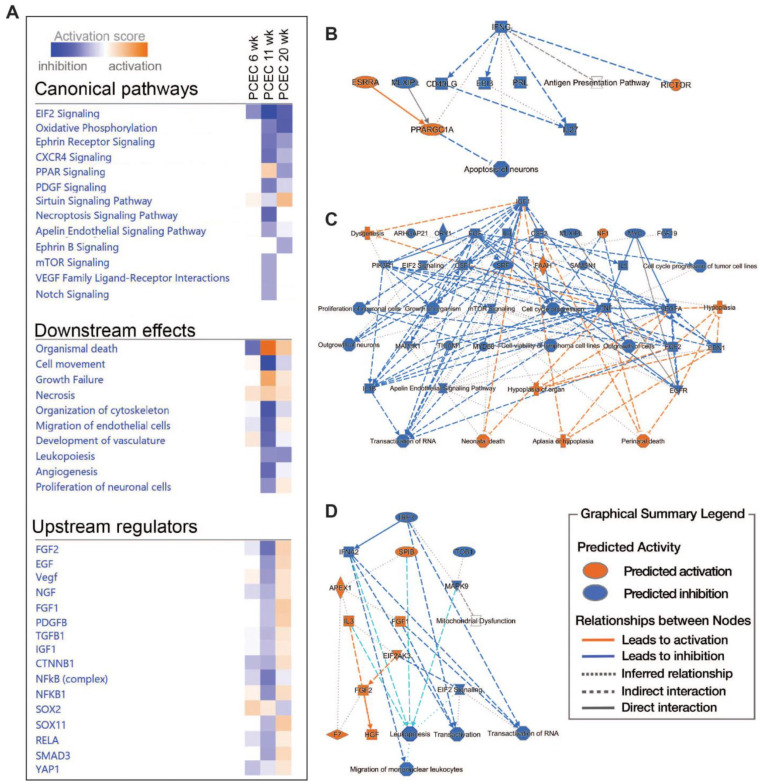
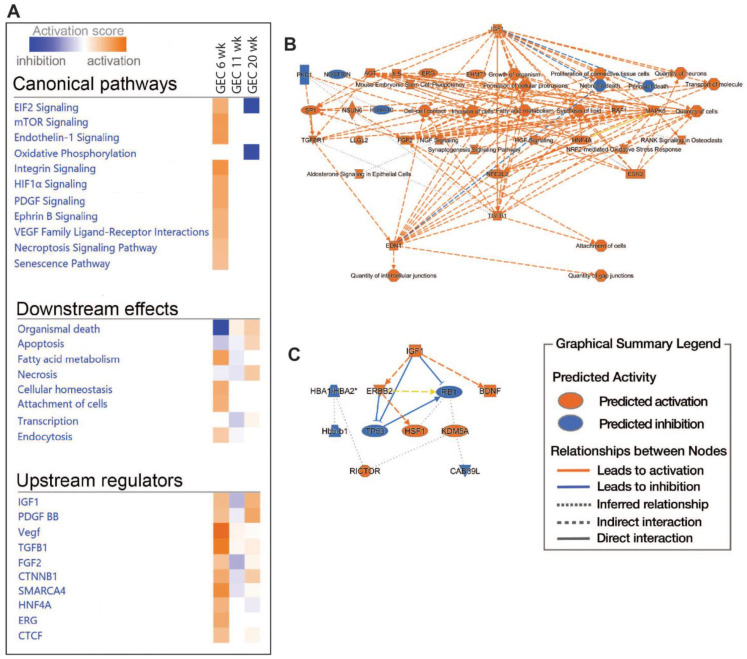
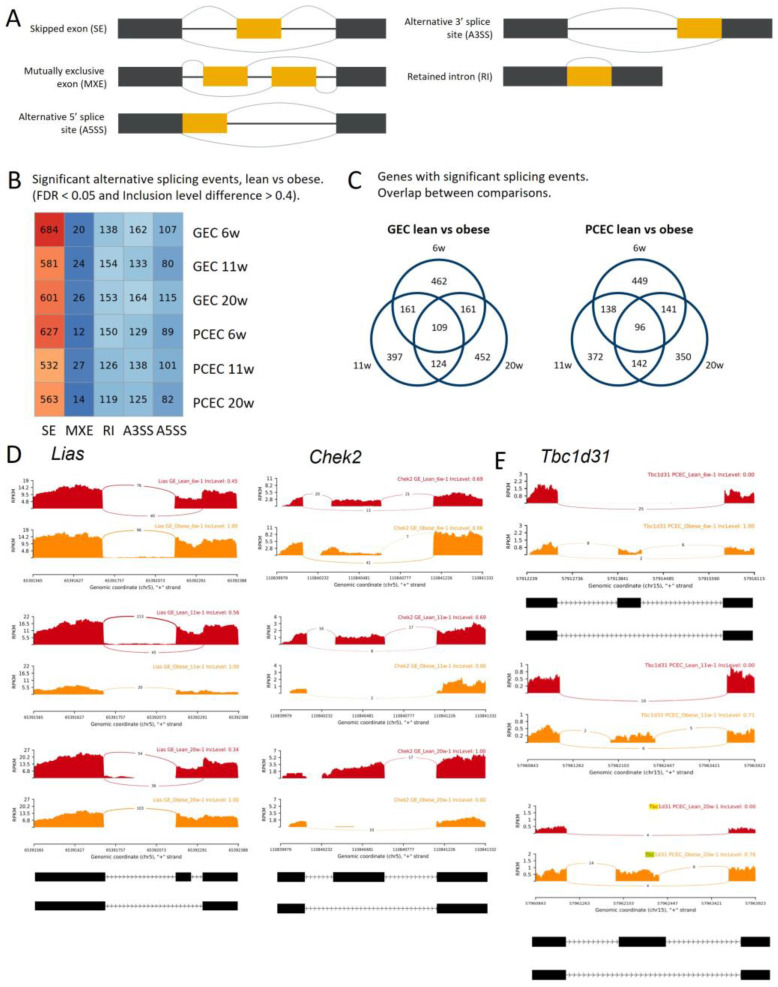
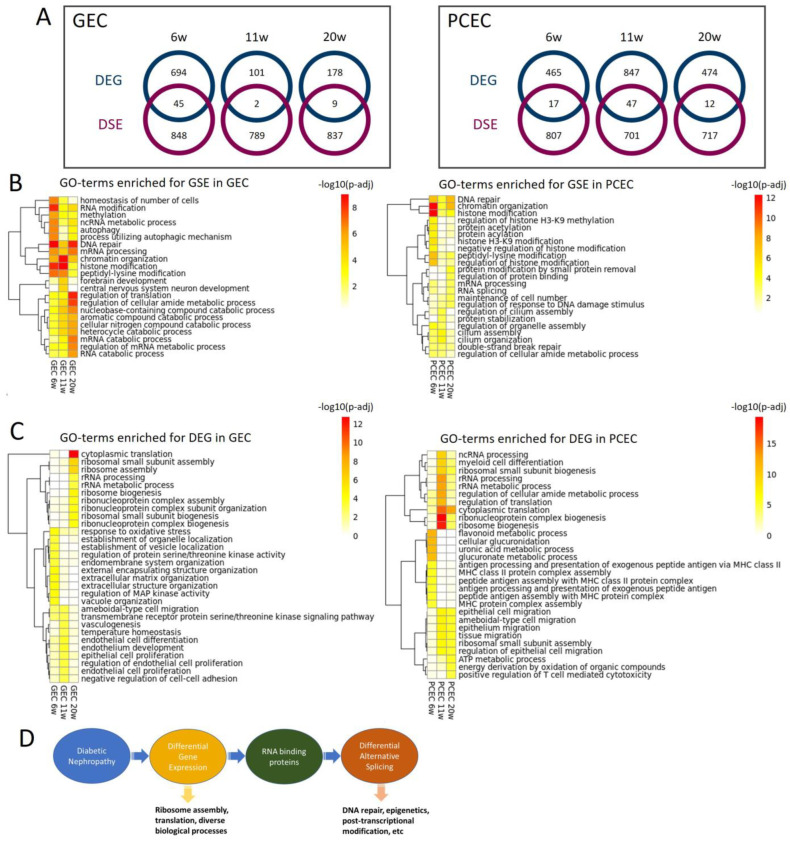
Endothelial cell (EC) injury is a crucial contributor to the progression of diabetic kidney disease (DKD), but the specific EC populations and mechanisms involved remain elusive. Kidney ECs (n = 5464) were collected at three timepoints from diabetic BTBRob/ob mice and non-diabetic littermates. Their heterogeneity, transcriptional changes, and alternative splicing during DKD progression were mapped using SmartSeq2 single-cell RNA sequencing (scRNAseq) and elucidated through pathway, network, and gene ontology enrichment analyses. We identified 13 distinct transcriptional EC phenotypes corresponding to different kidney vessel subtypes, confirmed through in situ hybridization and immunofluorescence. EC subtypes along nephrons displayed extensive zonation related to their functions. Differential gene expression analyses in peritubular and glomerular ECs in DKD underlined the regulation of DKD-relevant pathways including EIF2 signaling, oxidative phosphorylation, and IGF1 signaling. Importantly, this revealed the differential alteration of these pathways between the two EC subtypes and changes during disease progression. Furthermore, glomerular and peritubular ECs also displayed aberrant and dynamic alterations in alternative splicing (AS), which is strongly associated with DNA repair. Strikingly, genes displaying differential transcription or alternative splicing participate in divergent biological processes. Our study reveals the spatiotemporal regulation of gene transcription and AS linked to DKD progression, providing insight into pathomechanisms and clues to novel therapeutic targets for DKD treatment.
Keywords: diabetic nephropathy; endothelium; transcriptomics.
Conflict of interest statement
A.-X.Z., P.T., L.W., A.B.G., M.U., R.T., L.C. and P.B.L.H. are employed by AstraZeneca Gothenburg, Sweden, and L.O.L is an advisor. The funders had no role in the study design, data collection and analysis, decision to publish, or preparation of the manuscript.
Figures
Similar articles
-
Human carnosinase 1 overexpression aggravates diabetes and renal impairment in BTBROb/Ob mice.J Mol Med (Berl). 2020 Sep;98(9):1333-1346. doi: 10.1007/s00109-020-01957-0. Epub 2020 Aug 15. J Mol Med (Berl). 2020. PMID: 32803273 Free PMC article.
-
Endothelial Dysfunction in the Tubule Area Accelerates the Progression of Early Diabetic Kidney Disease.Physiol Res. 2024 Dec 31;73(6):1013-1024. doi: 10.33549/physiolres.935347. Physiol Res. 2024. PMID: 39903891 Free PMC article.
-
Single-cell RNA-seq with spatial transcriptomics to create an atlas of human diabetic kidney disease.FASEB J. 2023 Jun;37(6):e22938. doi: 10.1096/fj.202202013RR. FASEB J. 2023. PMID: 37130011
-
Long noncoding RNA: an emerging player in diabetes and diabetic kidney disease.Clin Sci (Lond). 2019 Jun 20;133(12):1321-1339. doi: 10.1042/CS20190372. Print 2019 Jun 28. Clin Sci (Lond). 2019. PMID: 31221822 Review.
-
Glomerular endothelial cell injury and cross talk in diabetic kidney disease.Am J Physiol Renal Physiol. 2015 Feb 15;308(4):F287-97. doi: 10.1152/ajprenal.00533.2014. Epub 2014 Nov 19. Am J Physiol Renal Physiol. 2015. PMID: 25411387 Free PMC article. Review.
Cited by
-
Logic-based modeling of inflammatory macrophage cross talk with glomerular endothelial cells in diabetic kidney disease.Am J Physiol Renal Physiol. 2025 Jul 1;329(1):F202-F224. doi: 10.1152/ajprenal.00362.2024. Epub 2025 May 26. Am J Physiol Renal Physiol. 2025. PMID: 40418541 Free PMC article.
-
Cross-Domain Text Mining of Pathophysiological Processes Associated with Diabetic Kidney Disease.Int J Mol Sci. 2024 Apr 19;25(8):4503. doi: 10.3390/ijms25084503. Int J Mol Sci. 2024. PMID: 38674089 Free PMC article.
References
-
- Dumas S.J., Meta E., Borri M., Goveia J., Rohlenova K., Conchinha N.V., Falkenberg K., Teuwen L.-A., de Rooij L., Kalucka J., et al. Single-Cell Rna Sequencing Reveals Renal Endothelium Heterogeneity and Metabolic Adaptation to Water Deprivation. J. Am. Soc. Nephrol. 2020;31:118–138. doi: 10.1681/ASN.2019080832. - DOI - PMC - PubMed
-
- He B., Chen P., Zambrano S., Dabaghie D., Hu Y., Möller-Hackbarth K., Unnersjö-Jess D., Korkut G.G., Charrin E., Jeansson M., et al. Single-cell RNA Sequencing Reveals the Mesangial Identity and Species Diversity of Glomerular Cell Transcriptomes. Nat. Commun. 2021;12:2141. doi: 10.1038/s41467-021-22331-9. - DOI - PMC - PubMed
MeSH terms
LinkOut - more resources
Full Text Sources
Medical
Molecular Biology Databases
Research Materials
Miscellaneous
