. 2024 Apr 14;25(8):4342.
doi: 10.3390/ijms25084342.

Duocarmycin SA Reduces Proliferation and Increases Apoptosis in Acute Myeloid Leukemia Cells In Vitro

Affiliations

Duocarmycin SA Reduces Proliferation and Increases Apoptosis in Acute Myeloid Leukemia Cells In Vitro

William A Chen et al. Int J Mol Sci. .

Abstract

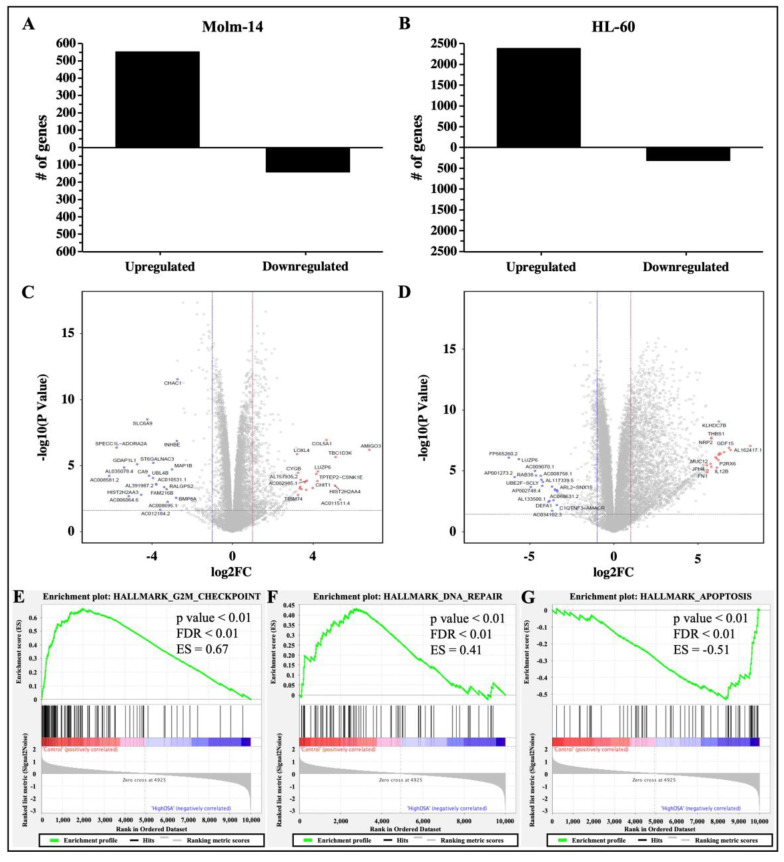
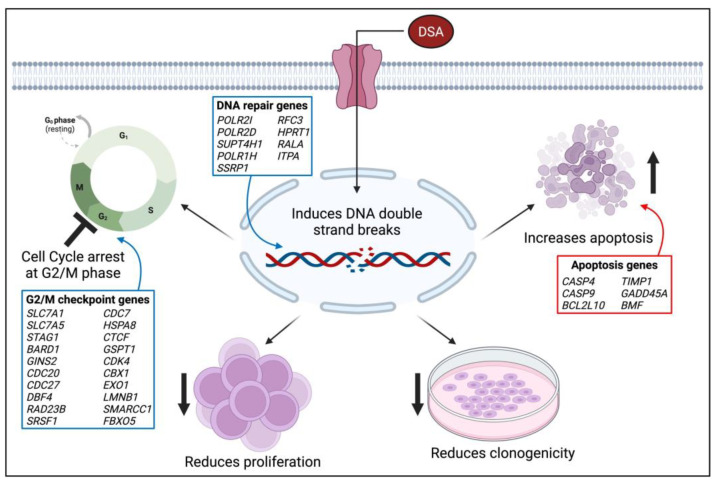
Acute myeloid leukemia (AML) is a hematological malignancy that is characterized by an expansion of immature myeloid precursors. Despite therapeutic advances, the prognosis of AML patients remains poor and there is a need for the evaluation of promising therapeutic candidates to treat the disease. The objective of this study was to evaluate the efficacy of duocarmycin Stable A (DSA) in AML cells in vitro. We hypothesized that DSA would induce DNA damage in the form of DNA double-strand breaks (DSBs) and exert cytotoxic effects on AML cells within the picomolar range. Human AML cell lines Molm-14 and HL-60 were used to perform 3-(4,5-dimethylthiazolyl-2)-2,5-diphenyltetrazolium bromide (MTT), DNA DSBs, cell cycle, 5-ethynyl-2-deoxyuridine (EdU), colony formation unit (CFU), Annexin V, RNA sequencing and other assays described in this study. Our results showed that DSA induced DNA DSBs, induced cell cycle arrest at the G2M phase, reduced proliferation and increased apoptosis in AML cells. Additionally, RNA sequencing results showed that DSA regulates genes that are associated with cellular processes such as DNA repair, G2M checkpoint and apoptosis. These results suggest that DSA is efficacious in AML cells and is therefore a promising potential therapeutic candidate that can be further evaluated for the treatment of AML.

Keywords: DNA alkylation; DNA double-strand break; acute myeloid leukemia; apoptosis; chemotherapy; duocarmycin SA.


Conflict of interest statement

The authors declare no conflicts of interest.

Figures

Figure 1
Figure 1
Immunophenotyping of AML cells. (A) AML cell lines (Molm-14 and HL-60) were stained with an antibody cocktail, fixed with paraformaldehyde and analyzed using flow cytometry. Shown in panel (A) are the representative dot plots of AML cells stained with CD45 and myeloid lineage markers CD33, CD14 and CD13, as well as bar graphs that quantify the expression of the myeloid markers. Shown in panel (B) are the representative dot plots and bar graphs of AML cell lines stained with T-lineage markers CD4 and CD8. Representative dot plots are one of 3 independent experiments and bar graphs are the mean ± SEM of 3 independent experiments. **** p < 0.0001.
Figure 2
Figure 2
DSA Shows Efficacy against AML Cells within the Picomolar Range. AML cells were plated at 5000 cells per well and incubated with vehicle (DMSO) or increasing concentrations of DSA (0, 1, 5, 10, 50, 100, 500 and 1000 pM) for 72 h and analyzed using the MTT assay. Dotted lines represent half of the maximal inhibitory concentration (IC50) for DSA. Shown in panel (A) are the dose response curves for Molm-14 (black squares) and HL-60 (white squares). Graphs were plotted using GraphPad Prism and the IC50 was calculated using a nonlinear regression model. The results are expressed as the mean ± SEM that is representative of 3 independent experiments. Shown in panel (B) is a bar graph of the dose response on a linear scale with a mean ± SEM that is representative of 3 independent experiments for Molm-14 (black bars) and HL-60 (white bars). * p < 0.05, ** p < 0.01, *** p < 0.001, **** p < 0.0001.
Figure 3
Figure 3
DSA Induces DNA Double-Strand Breaks in AML cells. AML cells (A, Molm-14; B, HL-60) were plated at 40,000 cells per well and incubated with vehicle (DMSO), etoposide or increasing concentrations of DSA. Cells were sequentially stained with an anti-phospho-histone (γH2A.X) antibody and a FITC-conjugated secondary antibody. Cells were imaged using fluorescence microscopy at a total magnification of 100×. Graphed in panel (C) is the fold change of γH2A.X foci in Molm-14 cells compared to vehicle (DMSO) control after treatment with DSA. Graphed in panel (D) is the fold change of γH2A.X foci in HL-60 cells compared to vehicle (DMSO) control after treatment with DSA. Fold change was calculated by normalizing the numerical count obtained in ImageJ for the vehicle control to one (1) and by dividing the counts obtained for each experimental group by the control to determine fold change relative to control. Data in Panels (C,D) are represented as the mean ± SEM of 3 independent experiments. ** p < 0.01, *** p < 0.001, **** p < 0.0001.
Figure 4
Figure 4
DSA Induced Cell Cycle Arrest in AML Cells at the G2/M Phase. Shown in panels (A) (Molm-14 cells) and (B) (HL-60 cells) are the percentages of propidium iodide+ cells in the G2/M phase of the cells’ cycle. Cells were incubated with vehicle (DMSO) or increasing concentrations of DSA for 24, 48 and 72 h and flow cytometry was performed. Analysis was performed using the Flowjo software and the bar graphs were generated using GraphPad Prism. Shown is the mean ± SEM that is representative of 3 independent experiments for each cell line. * p < 0.05, ** p < 0.01, *** p < 0.001, **** p < 0.0001.
Figure 5
Figure 5
DSA Decreases the Proliferation of AML Cells. Molm-14 cells were plated at ~53,000 cells per well, incubated with vehicle (DMSO) or increasing concentrations of DSA for 4 days, and simultaneously treated with EdU for 3 days. Cells were harvested, fixed and permeabilized prior to sequential staining with the Alexa Fluor 647 and Hoechst 33342 dyes. Wells were imaged using fluorescence microscopy at a total magnification of 100×. Panel (A) shows images of Molm-14 cells that are representative of one of three independent experiments. Panel (B) shows a bar graph of the percentage of EdU+/Hoechst+ Molm-14 cells which was calculated by dividing the number of EdU+ cells by the number of Hoechst+ cells multiplied by 100. Data are representative of the mean ± SEM of 3 independent experiments. Panel (C) shows a bar graph of the percentage of EdU+/Hoechst+ HL-60 cells which was generated similarly to the data shown in panel (B). Data are representative of the mean ± SEM of 3 independent experiments. ** p < 0.01, *** p < 0.001, **** p < 0.0001.
Figure 6
Figure 6
DSA Reduces the Clonogenicity of AML cells. AML cells (A, Molm-14; B, HL-60) were seeded at 500 cells per plate (in triplicate) in MethocultTM H4435 and incubated with vehicle (DMSO) or increasing concentrations of DSA for 7 days. Colonies were counted on day 7 using an inverted light microscope. Data represent the mean ± SEM that is representative of 3 independent experiments. *** p < 0.001, **** p < 0.0001.
Figure 7
Figure 7
DSA Increases Apoptosis in AML Cells. AML cells (Molm-14 or HL-60) were incubated with vehicle (DMSO) or increasing concentrations of DSA. Cells were harvested at 24, 48 and 72 h, stained with Annexin V and 7-AAD to detect apoptotic cells and analyzed by flow cytometry. Shown in panel (A) are representative dot plots of early-stage (Q1: Annexin V+) and late-stage (Q2: Annexin V+7-AAD+) apoptotic Molm-14 cells after treatment with DSA at the various time points. Shown in panel (B) are bar graphs showing the percentage of apoptotic Molm-14 cells which was determined by adding the percentages of apoptotic cells in Q1 + Q2, then dividing by the total percentage (Q1 + Q2 + Q3 + Q4). Data are representative of the mean ± SEM of 3 independent experiments. Shown in panel (C) are bar graphs showing the percentage of apoptotic HL-60 cells which was calculated using the same method described in panel (B). Data are representative of the mean ± SEM of 3 independent experiments. * p < 0.05, ** p < 0.01, *** p < 0.001, **** p < 0.0001.
Figure 8
Figure 8
RNA Sequencing Analysis of AML Cells Treated with DSA. AML cells were plated at 6.0 × 10⁵ cells per well and incubated with DSA (Molm-14: 100 pM DSA; HL60: 500 pM DSA) or without DSA. Cells were harvested at 36 h and RNA was isolated. Differential gene expression was modeled using the voom method. The bar graphs represent the number of genes that were upregulated or downregulated (fold change > 2, p-value < 0.05) in Molm-14 (A) and HL-60 (B) cells treated with DSA compared to untreated controls. The volcano plots represent the top 20 statistically significant genes that were upregulated (red dots) or downregulated (blue dots) in Molm-14 (C) and the top 20 statistically significant genes that were upregulated (red dots) or downregulated (blue dots) in HL-60 (D) cells. The horizontal dashed lines represent the statistical significance threshold (adjusted p-values ≤ 0.05) and the two vertical dashed lines represent the threshold of log2 fold-change ≥1 and ≤−1 for both volcano plots. (EG) GSEA revealed three overlapping pathways (G2M Checkpoint, DNA-repair and Apoptosis) that were significantly enriched upon treatment with high DSA (HL-60 and Molm-14 treated with 100 pM and 500 pM respectively) compared to controls (HL-60 and Molm-14 untreated). The p-value, FDR value and enrichment scores (ES) are included in each enrichment plot.
Figure 9
Figure 9
DSA-induced Differentially Expressed Genes that Overlap between Molm-14 and HL-60 Cells. The Venn diagram shows the number of genes that are unique to Molm-14 cells (340), unique to HL-60 cells (2749) and overlapping between both cells (353). The significance threshold was set at fold change >2 and p-value < 0.05.
Figure 10
Figure 10
Model of DSA’s Mechanism of Action on AML Cells. The proposed model summarizes the functional effects of DSA on AML cells in vitro. The blue boxes represent genes that are downregulated and the red boxes represent genes that are upregulated. The image was created using BioRender.com. Symbols: ↑—increase; ↓—reduce; 丄—inhibit.

Similar articles

Cited by

References

    1. De Kouchkovsky I., Abdul-Hay M. Acute myeloid leukemia: A comprehensive review and 2016 update. Blood Cancer J. 2016;6:e441. doi: 10.1038/bcj.2016.50. - DOI - PMC - PubMed
    1. Khwaja A., Bjorkholm M., Gale R.E., Levine R.L., Jordan C.T., Ehninger G., Bloomfield C.D., Estey E., Burnett A., Cornelissen J.J., et al. Acute myeloid leukaemia. Nat. Rev. Dis. Primers. 2016;2:16010. doi: 10.1038/nrdp.2016.10. - DOI - PubMed
    1. Howlader N., Noone A., Krapcho M., Miller D., Brest A., Yu M., Ruhl J., Tatalovich Z., Mariotto A., Lewis D.R., et al. SEER Cancer Statistics Review, 1975–2017. National Cancer Institute; Bethesda, MD, USA: 2020.
    1. Grimwade D., Ivey A., Huntly B.J.P. Molecular landscape of acute myeloid leukemia in younger adults and its clinical relevance. Blood. 2016;127:29–41. doi: 10.1182/blood-2015-07-604496. - DOI - PMC - PubMed
    1. Papaemmanuil E., Gerstung M., Bullinger L., Gaidzik V.I., Paschka P., Roberts N.D., Potter N.E., Heuser M., Thol F., Bolli N., et al. Genomic Classification and Prognosis in Acute Myeloid Leukemia. N. Engl. J. Med. 2016;374:2209–2221. doi: 10.1056/NEJMoa1516192. - DOI - PMC - PubMed

MeSH terms