. 2024 Apr 15;25(8):4369.
doi: 10.3390/ijms25084369.

Low-Protein Diets Differentially Regulate Energy Balance during Thermoneutral and Heat Stress in Cobb Broiler Chicken (Gallus domesticus)

Affiliations

Low-Protein Diets Differentially Regulate Energy Balance during Thermoneutral and Heat Stress in Cobb Broiler Chicken (Gallus domesticus)

Julia Sutton et al. Int J Mol Sci. .

Abstract

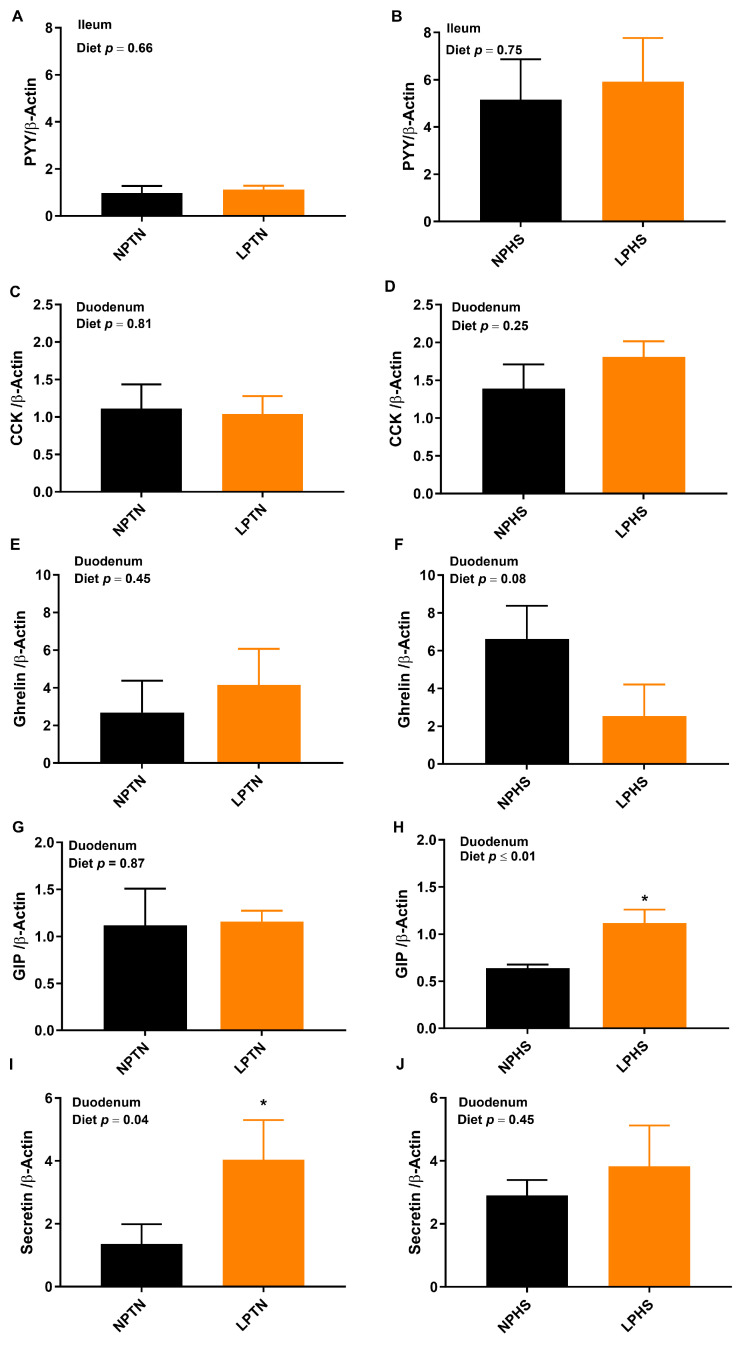
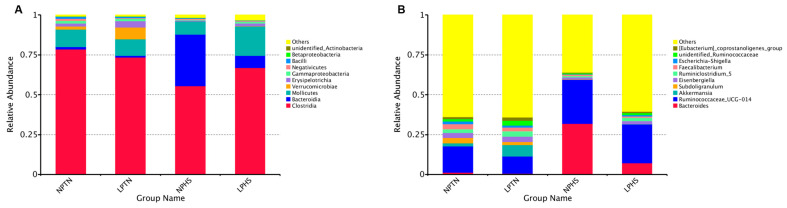
The objective was to assess whether low-protein (LP) diets regulate food intake (FI) and thermogenesis differently during thermoneutral (TN) and heat stress (HS) conditions. Two-hundred-day-old male broiler chicks were weight-matched and assigned to 36 pens with 5-6 chicks/pen. After 2 weeks of acclimation, birds were subjected into four groups (9 pens/group) including (1) a normal-protein diet under TN (ambient temperature), (2) an LP diet under TN, (3) a normal-protein diet under HS (35 °C for 7 h/day), and (4) an LP diet under HS, for 4 weeks. During HS, but not TN, LP tended to decrease FI, which might be associated with a lower mRNA abundance of duodenal ghrelin and higher GIP during HS. The LP group had a higher thermal radiation than NP under TN, but during HS, the LP group had a lower thermal radiation than NP. This was linked with higher a transcript of muscle β1AR and AMPKα1 during TN, but not HS. Further, LP increased the gene expression of COX IV during TN but reduced COX IV and the sirtuin 1 abundance during HS. The dietary protein content differentially impacted plasma metabolome during TN and HS with divergent changes in amino acids such as tyrosine and tryptophan. Compared to NP, LP had increased abundances of p_Tenericutes, c_Mollicutes, c_Mollicutes_RF9, and f_tachnospiraceae under HS. Overall, LP diets may mitigate the negative outcome of heat stress on the survivability of birds by reducing FI and heat production. The differential effect of an LP diet on energy balance during TN and HS is likely regulated by gut and skeletal muscle and alterations in plasma metabolites and cecal microbiota.

Keywords: energy balance; heat stress; low-protein diet; thermoneutral.


Conflict of interest statement

The authors declare no conflicts of interest.

Figures

Figure 1
Figure 1
Survival curve of broilers fed with low-protein diets during experimentally induced heat stress. Effect of low-protein diets on survival (%) of broilers during thermoneutral (TN) (A) and heat stress (HS) (B). NPTN: normal-protein diet under TN; LPTN: low-protein diet under TN; NPHS: normal-protein diet under HS; LPHS: low-protein diet under HS. The p-values for the overall model effects for diet, temperature (temp), week, diet × temp, diet × week, temp × week, and diet × week × temp were 0.27, ≤0.01, ≤0.01, 0.02, 0.14, ≤0.01, 0.38. n = 9 per treatment.
Figure 2
Figure 2
Thermal radiation of broilers fed with low-protein diets during experimentally induced heat stress. Effect of low-protein diets on thermal radiation (A,B) and the area under the curve (AUC) of thermal radiation (C,D) of broilers during thermoneutral (TN) (A,C) and heat stress (HS) (B,D). A representative screenshot of a thermal image for broilers during TN (E) and HS (F). NPTN: normal-protein diet under TN; LPTN: low-protein diet under TN; NPHS: normal-protein diet under HS; LPHS: low-protein diet under HS. RT: room temperature. The p-values for the overall model effects of diet, temperature (temp), day, diet × temp, diet × day, day × temp, and diet × temp × day for thermal radiation were 0.99, ≤0.01, ≤0.01, ≤0.01, 0.56, ≤0.01, 0.03, respectively. The p-values for the overall model effects for diet, temp, and diet × temp for AUC thermal radiation were 0.75, ≤0.01, and ≤0.01, respectively. Asterisks (*) in the bar plots indicate a significant difference (p ≤ 0.05, t-test). The values are the mean ± standard errors of means; n = 9.
Figure 3
Figure 3
mRNA abundance of food intake markers in the duodenum or ileum of broilers fed low-protein diets during experimentally induced heat stress. Effect of low-protein diets on mRNA abundance of peptide YY (PYY) (A,B), cholecystokinin (CCK) (C,D), ghrelin (E,F), gastric inhibitory polypeptide (GIP) (G,H), and secretin (I,J) in duodenum or ileum of broilers during thermoneutral (TN) (A,C,E,G,I) and heat stress (HS) (B,D,F,H,J). NPTN: normal-protein diet under TN; LPTN: low-protein diet under TN; NPHS: normal-protein diet under HS; LPHS: low-protein diet under HS. The p-values for the overall model effects of diet, temperature (temp), and diet × temp for PYY were 0.74, ≤0.01, 0.82, for CCK were 0.45, 0.03, 0.29, for ghrelin were 0.37, 0.42, 0.07, for GIP were 0.05, 0.05, 0.10, and for secretin were 0.04, 0.42, 0.29. Asterisks (*) in the bar plots indicate a significant difference (p ≤ 0.05, t-test). The values are the mean ± standard errors of means; n = 8.
Figure 4
Figure 4
mRNA abundance of thermogenesis markers in muscle of broilers fed low-protein diets during experimentally induced heat stress. Effect of low-protein diets on mRNA abundance of β-1 adrenergic receptor (β1AR) (A,B), AMP-activated protein kinase α1 (AMPKα1) (C,D), sirtuin 1 (E,F), cytochrome c oxidase subunit IV (COX IV) (G,H), and peroxisome proliferator-activated receptor- gamma coactivator 1α (PGC-1α) (I,J) in the muscle in broilers during thermoneutral (TN) (A,C,E,G,I) and heat stress (HS) (B,D,F,H,J). NPTN: normal-protein diet under TN; LPTN: low-protein diet under TN; NPHS: normal-protein diet under HS; LPHS: low-protein diet under HS. The p-values for the overall model effects of diet, temperature (temp), and diet × temp for β1AR were 0.08, ≤0.01, 0.02, for AMPKα1 were 0.07, ≤0.01, 0.02, for sirtuin 1 were 0.07, 0.02, 0.06, for COX IV were 0.88, 0.12, ≤0.01, and for PGC-1α were 0.17, 0.02, 0.32. Asterisks (*) in the bar plots indicate a significant difference (p ≤ 0.05, t-test). The values are the mean ± standard errors of means; n = 8.
Figure 5
Figure 5
Superoxide dismutase activity, glutathione peroxidase activity, and lipid peroxidation in plasma of broilers fed with low-protein diets during experimentally induced heat stress. Effect of low-protein diets on superoxide dismutase (SOD) activity (A,B), glutathione peroxidase (GPx) activity (C,D), lipid peroxidation of malondialdehyde (MDA) (E,F), and lipid hydroperoxide (LPO) (G,H) of broilers during thermoneutral (TN) (A,C,E) and heat stress (HS) (B,D,F). NPTN: normal-protein diet under TN; LPTN: low-protein diet under TN; NPHS: normal-protein diet under HS; LPHS: low-protein diet under HS. The p-values for the overall model effects for diet, temperature (temp), diet × temp, for SOD activity were 0.12, 0.49, 0.05, for GPx activity were 0.74, 0.28, 0.98, for MDA were 0.12, ≤0.01, 0.35, and for LPO were 0.02, 0.11, and 0.24. Asterisks (*) in the bar plots indicate a significant difference (p ≤ 0.05, t-test). The values are the mean ± standard errors of means. n = 5–6 per treatment for SOD activity, n = 9 per treatment for GPx activity, MDA and LPO.
Figure 6
Figure 6
Principal component analysis (PCA) score plots of plasma metabolites in broilers fed with low-protein diets during experimentally induced heat stress. PCA score plots of plasma metabolites for NPTN vs. LPTN (A), NPHS vs. LPHS (B), NPTN vs. NPHS (C), and LPTN vs. LPHS (D). NPTN: normal-protein diet under TN; LPTN: low-protein diet under TN; NPHS: normal-protein diet under HS; LPHS: low-protein diet under HS. Each node represents an individual bird. n = 8.
Figure 7
Figure 7
Heat map of plasma metabolites in broilers fed with low-protein diets during experimentally induced heat stress. Hierarchical clustering of all significantly different plasma metabolites in birds used in the current study (A) and among birds that received NPTN, LPTN, LPHS, and HPHS (B). The rows display metabolites, and the columns represent the birds (Figure 4A) or experimental groups (Figure 4B). The dark red or blue box corresponds to the magnitude of difference when compared with the average value. The black dendrogram along the left side of the heatmap indicates both the similarity and the order of the clusters that were formed. NPTN: normal-protein diet under TN; LPTN: low-protein diet under TN; NPHS: normal-protein diet under HS; LPHS: low-protein diet under HS. n = 8.
Figure 8
Figure 8
Pathway analysis map of plasma metabolites in broilers fed with low-protein diets during experimentally induced heat stress. The map of the pathway analysis for the metabolites detected in the blood serum of broilers fed with NPTN vs. LPTN (A), NPHS vs. LPHS (B), NPTN vs. NPHS (C), and LPTN vs. LPHS (D). Each circle shows a metabolic pathway. The scores were obtained from topology analysis with pathway impact (x axis) and the pathway enrichment analysis (y axis). The color of each circle is a function of its p-value and pathway enrichment, while the size of each circle is determined on the basis of its impact value. Therefore, the darker color circles show the metabolites with more significant changes and higher pathway enrichment, and the larger circles are the ones with higher pathway impact. NPTN: normal-protein diet under thermoneutral; LPTN: low-protein diet under thermoneutral; NPHS: normal-protein diet under heat stress; LPHS: low-protein diet under heat stress. n = 8.
Figure 9
Figure 9
Beta diversity of cecal bacterial community in broilers fed with low-protein diets during experimentally induced heat stress. Principal coordinate analysis (PCoA) of unweighted UniFrac distances, representing the diversity of cecal bacterial populations across all birds assigned to 4 treatments with each node being indicative of an individual bird (A), unweighted UniFrac distances shown across dietary groups (B), PCoA of weighted UniFrac distances, representing the diversity of cecal bacterial populations across all birds assigned to 4 treatments, with each node being indicative of an individual bird (C), and weighted UniFrac distances shown across dietary groups (D). NPTN: normal-protein diet under thermoneutral; LPTN: low-protein diet under thermoneutral; NPHS: normal-protein diet under heat stress; LPHS: low-protein diet under heat stress. Common asterisks (*) in the box plots indicate a tendency for significance (0.05 < p ≤ 0.1, Tukey HSD). Outliers are shown as dots. n = 6 per treatment.
Figure 10
Figure 10
Alpha diversity of cecal bacterial community in broilers fed with low-protein diets during experimentally induced heat stress. Chao1 (A), Observed (B), Shannon (C), and Simpson (D). NPTN: normal-protein diet under thermoneutral; LPTN: low-protein diet under thermoneutral; NPHS: normal-protein diet under heat stress; LPHS: low-protein diet under heat stress. Different letters in the box plots indicate significant differences (p ≤ 0.05, Tukey HSD). n = 6 per treatment.
Figure 11
Figure 11
The composition of cecal bacterial populations in broilers fed with low-protein diets during experimentally induced heat stress. The relative abundance of bacterial community composition at the phylum level (A) and at the genus level (B). NPTN: normal-protein diet under thermoneutral; LPTN: low-protein diet under thermoneutral; NPHS: normal-protein diet under heat stress; LPHS: low-protein diet under heat stress. For clarity reasons, only the top 10 phyla and genera are shown. n = 6 for each treatment.
Figure 12
Figure 12
Histograms of cecal microbiota composition at the phylum level in broilers fed with low-protein diets during experimentally induced heat stress. Histograms of cecal microbiota composition using linear discriminant analysis (LDA) with effect size (LEfSe) for NPTN vs. LPTN (A), NPHS vs. LPHS (B), NPTN vs. NPHS (C), and LPTN vs. LPHS (D). NPTN: normal-protein diet under thermoneutral; LPTN: low-protein diet under thermoneutral; NPHS: normal-protein diet under heat stress; LPHS: low-protein diet under heat stress. n = 6 per treatment.

Similar articles

Cited by

References

    1. Syafwan S., Kwakkel R., Verstegen M. Heat stress and feeding strategies in meat-type chickens. World’s Poult. Sci. J. 2011;67:653–674. doi: 10.1017/S0043933911000742. - DOI
    1. Lara L.J., Rostagno M.H. Impact of Heat Stress on Poultry Production. Animals. 2013;3:356–369. doi: 10.3390/ani3020356. - DOI - PMC - PubMed
    1. Zulkifli I., Akmal A.F., Soleimani A.F., Hossain M.A., Awad E.A. Effects of low-protein diets on acute phase proteins and heat shock protein 70 responses, and growth performance in broiler chickens under heat stress condition. Poult. Sci. 2018;97:1306–1314. doi: 10.3382/ps/pex436. - DOI - PubMed
    1. Waldroup P.W. Influence of environmental temperature on protein and amino acid needs of poultry. Fed. Proc. 1982;41:2821–2823. - PubMed
    1. Gous R.M., Morris T.R. Nutritional interventions in alleviating the effects of high temperatures in broiler production. World’s Poult. Sci. J. 2005;61:463–475. doi: 10.1079/WPS200568. - DOI

LinkOut - more resources