. 2024 Apr 17;25(8):4406.
doi: 10.3390/ijms25084406.

Review of Patient Gene Profiles Obtained through a Non-Negative Matrix Factorization-Based Framework to Determine the Role Inflammation Plays in Neuroblastoma Pathogenesis

Affiliations

Review of Patient Gene Profiles Obtained through a Non-Negative Matrix Factorization-Based Framework to Determine the Role Inflammation Plays in Neuroblastoma Pathogenesis

Angelina Boccarelli et al. Int J Mol Sci. .

Abstract

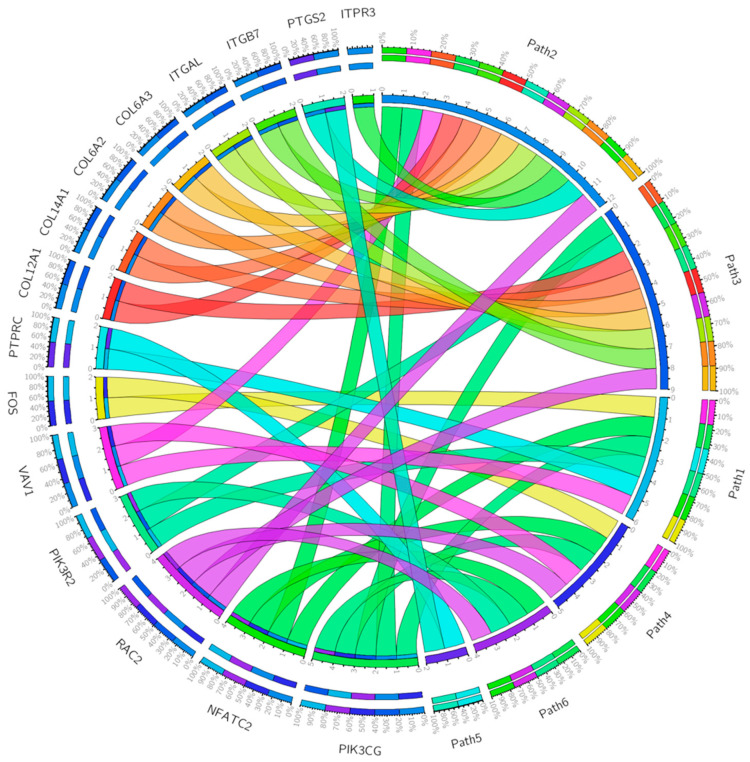
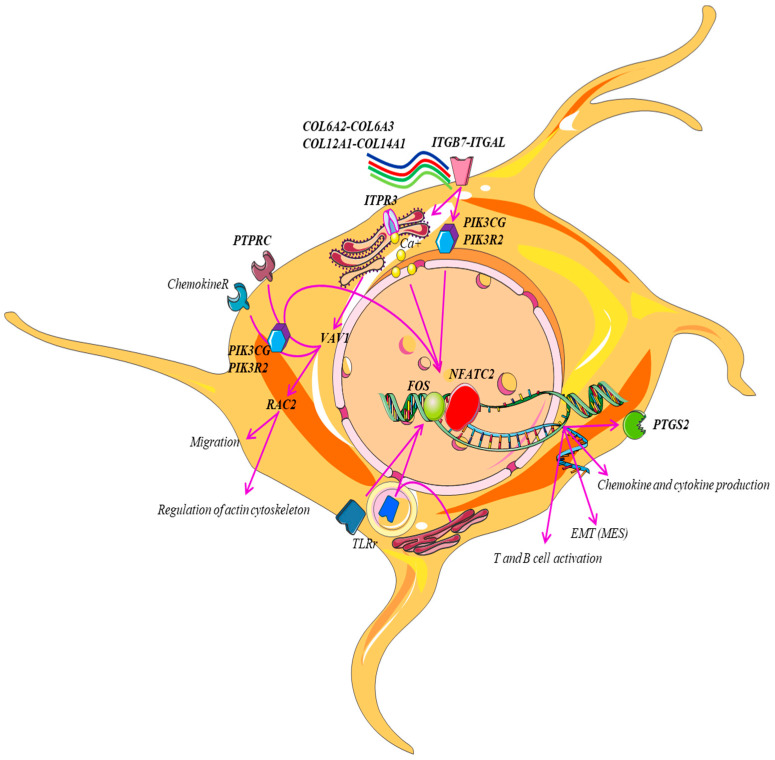
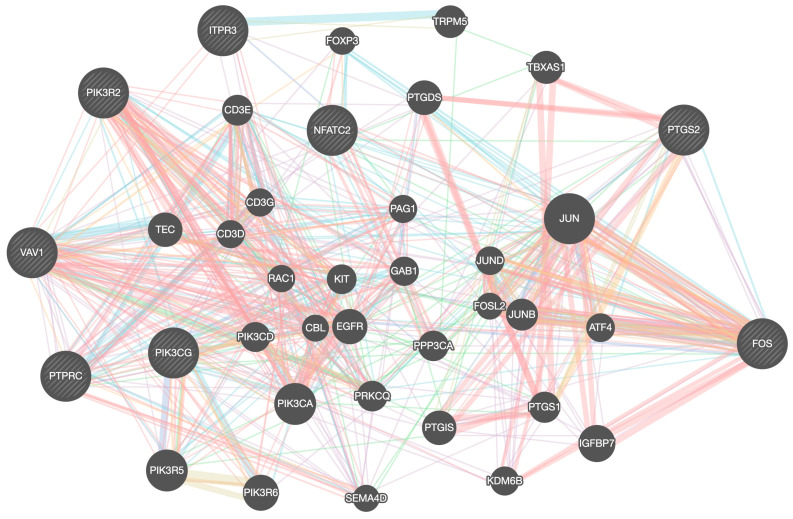
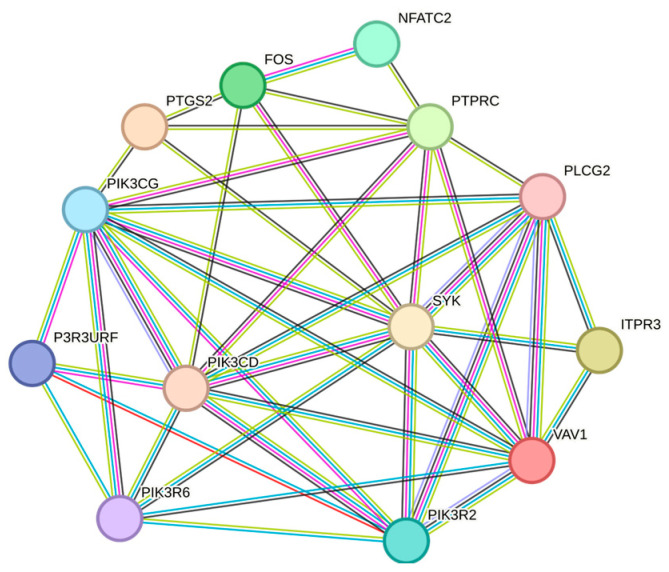
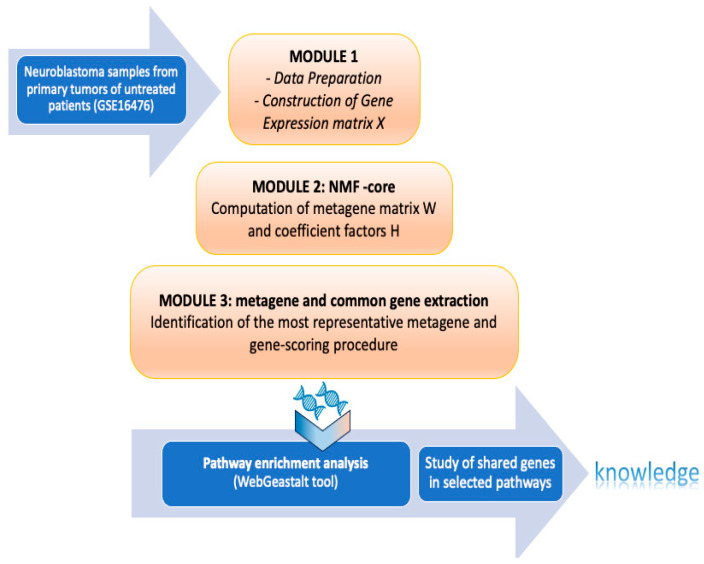
Neuroblastoma is the most common extracranial solid tumor in children. It is a highly heterogeneous tumor consisting of different subcellular types and genetic abnormalities. Literature data confirm the biological and clinical complexity of this cancer, which requires a wider availability of gene targets for the implementation of personalized therapy. This paper presents a study of neuroblastoma samples from primary tumors of untreated patients. The focus of this analysis is to evaluate the impact that the inflammatory process may have on the pathogenesis of neuroblastoma. Eighty-eight gene profiles were selected and analyzed using a non-negative matrix factorization framework to extract a subset of genes relevant to the identification of an inflammatory phenotype, whose targets (PIK3CG, NFATC2, PIK3R2, VAV1, RAC2, COL6A2, COL6A3, COL12A1, COL14A1, ITGAL, ITGB7, FOS, PTGS2, PTPRC, ITPR3) allow further investigation. Based on the genetic signals automatically derived from the data used, neuroblastoma could be classified according to stage rather than as a "cold" or "poorly immunogenic" tumor.

Keywords: biomarkers; gene profiling; inflammatory phenotype; neuroblastoma.


Conflict of interest statement

The authors declare no conflicts of interest.

Figures

Figure 1
Figure 1
Shared genes in the six pathways selected by the WebGeastalt tool that meet the significance criteria (FDR < 1; p-value < 0.05). The circular graph showing the binary relationship between the six selected pathways and their shared genes was obtained using Circos visualization software [14] (Version 3, 29 June 2007). The ribbons represent the relationships (the twists on the ribbons indicate the orientation of the link), the circular segments represent the genes and the pathways to which they are linked (Path1 = T-cell activation, Path2 = chemokine- and cytokine-mediated inflammation pathway, Path3 = integrin signaling pathway, Path4 = B-cell activation, Path5 = Toll receptor signaling pathway, Path6 = netrin-mediated axon guidance). Inflammation mediated by the chemokine and cytokine signaling pathway shares 12 genes: COL6A2, COL6A3, COL12A1, COL14A1, ITGB7, ITGAL, ITPR3, NFATC2, PIK3CG, PTGS2, RAC2, VAV1. The integrin signaling pathway shares 9 genes: COL6A2, COL6A3, COL12A1, COL14A1, ITGAL, ITGB7, PIK3CG, PIK3R2, RAC2. B-cell activation shares 6 genes: ITPR3, FOS, NFATC2, PIK3CG, PTPRC, RAC2, VAV1. T-cell activation shares 5 genes: FOS, NFATC2, PIK3R2, PIK3CG, PTPRC, VAV1. Netrin-mediated axon guidance shares 4 genes: NFATC2, PIK3CG, PIK3R2, RAC2. The toll receptor signaling pathway shares only the gene PTGS2.
Figure 2
Figure 2
Representative scheme of the 15 genes shared by the selected pathways using pathway enrichment analysis. Our model shows the mechanisms that converge to activate NFATC2 and other targets such as PIK3CG that are shared by the action of different stimuli. Some factors in the tumor microenvironment (COL6A2, COL6A3, COL12A1, COL14A1, chemokines, cytokines, etc.) can promote crosstalk between NFATC2 and PIK3CG and can promote crosstalk between receptor types (ITGB7, ITGAL, PTPRC, chemokine R) that induce the activation of signals (ITPR3, PIK3CG, PIK3R2, VAV1, RAC2) that have downstream pro-inflammatory and non-pro-inflammatory effects: production of PTGS2, cytokines, and chemokines and activation of T and B cells.
Figure 3
Figure 3
The gene association networks that result from entering the list of eight genes—PIK3CG, PTGS2, FOS, PTPRC, VAV1, ITPR3, NFATC2, and PIK3R2—as input into the GeneMANIA software. GeneMANIA extends the user’s list with genes that are functionally similar, or share properties with the initial query genes, and displays an interactive functional association network, illustrating the relationships among these genes and datasets. The size of each node is proportional to the number of physical interactions (pink edges) among other genes and indicates the importance of this gene as a hub in the network. Genes that are co-expressed are shown by light violet edges, and pathways involving related nodes are indicated by cyan edges.
Figure 4
Figure 4
The gene association networks that result from entering the list of eight genes—PIK3CG, PTGS2, FOS, PTPRC, VAV1, ITPR3, NFATC2, and PIK3R2—as input into the STRING software (version 3.5.2). The depicted network has 13 nodes, 41 edges, an average node degree of 6.31, and a PPI enrichment p-value of 7.59 × 10⁻¹³.
Figure 5
Figure 5
Scheme of the NMF framework adopted to extract subgroups of genes relevant to the sample of NB included in the GSE16476 dataset. The three sequential steps are as follows: (1) pre-process raw data and construct a matrix representation of them, namely the gene expression non-negative matrix X; (2) factorize X into metagene matrix W and a coefficient factor H (with rank information equal to r = 5); (3) identify the most representative metagene in W, namely Metagene4, and rank its relevant genes. The subset of selected genes is subjected to post-processing analysis to determine their role in the inflammatory process and pathway enrichment analysis in NB.
Figure 6
Figure 6
Evaluation of the most appropriate rank value to be used in the factorization process of the microarray matrix representing the NB data. The six pictures in the first panel (NMF rank survey) report the behavior of different measures useful to define the proper number of metagenes to extract from the data (i.e., the rank r of the factorization process). The second panel, instead, reports the plots of the consensus matrices obtained with different rank values (r = 2…,7). From a deep analysis of both the plots of the Cophenetic Correlation Coefficients (CCC) and the consensus matrices, it can be deduced that the value k = 5 is the first value at which the CCC trend starts to decrease. This made it possible to determine the rank of k = 5 for the purpose of computing the matrices W and H, that are the most appropriate to discretize the NB dataset.
Figure 7
Figure 7
Expression profiles of the extracted genes plotted as a heatmap. Rows show individual genes, columns show individual samples. Red tiles indicate expression above, yellow tiles indicate expression below the median transcript level for that gene across all samples. Color saturation is proportional to the magnitude of the difference from the median. Genes and conditions were clustered using an average linkage algorithm.

Similar articles

Cited by

References

    1. Irwin M.S., Park J.R. Neuroblastoma: Paradigm for precision medicine. Pediatr. Clin. N. Am. 2015;62:225–256. doi: 10.1016/j.pcl.2014.09.015. - DOI - PubMed
    1. Kholodenko I.V., Kalinovsky D.V., Doronin I.I., Deyev S.M., Kholodenko R.V. Neuroblastoma Origin and Therapeutic Targets for Immunotherapy. J. Immunol. Res. 2018;2018:7394268. doi: 10.1155/2018/7394268. - DOI - PMC - PubMed
    1. Pathania A.S., Prathipati P., Murakonda S.P., Murakonda A.B., Srivastava A., Avadhesh, Byrareddy S.N., Coulter D.W., Gupta S.C., Challagundla K.B. Immune checkpoint molecules in neuroblastoma: A clinical perspective. Pt 2Semin. Cancer Biol. 2022;86:247–258. doi: 10.1016/j.semcancer.2022.06.013. - DOI - PubMed
    1. Lundberg K.I., Treis D., Johnsen J.I. Neuroblastoma Heterogeneity, Plasticity, and Emerging Therapies. Curr. Onc. Rep. 2022;24:1053–1062. doi: 10.1007/s11912-022-01270-8. - DOI - PMC - PubMed
    1. Aravindan N., Jain D., Somasundaram D.B., Herman E.S., Aravindan S. Cancer stem cells in neuroblastoma therapy resistance. Cancer Drug Resist. 2019;2:948–967. doi: 10.20517/cdr.2019.72. - DOI - PMC - PubMed