. 2024 Apr 15;17(4):502.
doi: 10.3390/ph17040502.

Effects of Ganjianglingzhu Decoction on Lean Non-Alcoholic Fatty Liver Disease in Mice Based on Untargeted Metabolomics

Affiliations

Effects of Ganjianglingzhu Decoction on Lean Non-Alcoholic Fatty Liver Disease in Mice Based on Untargeted Metabolomics

Nan Tang et al. Pharmaceuticals (Basel). .

Abstract

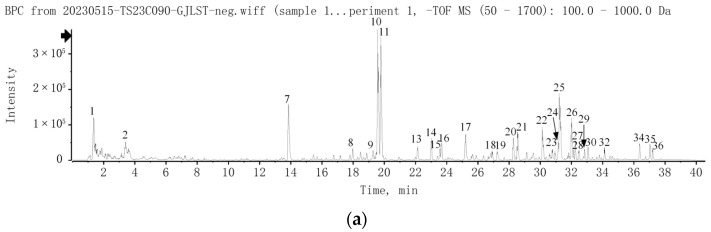
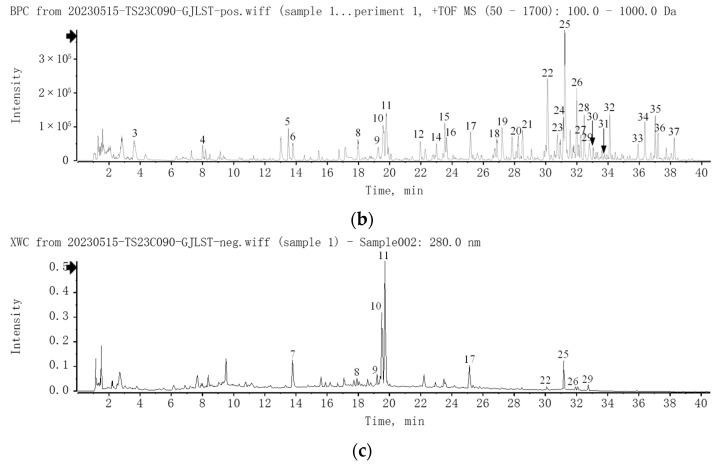
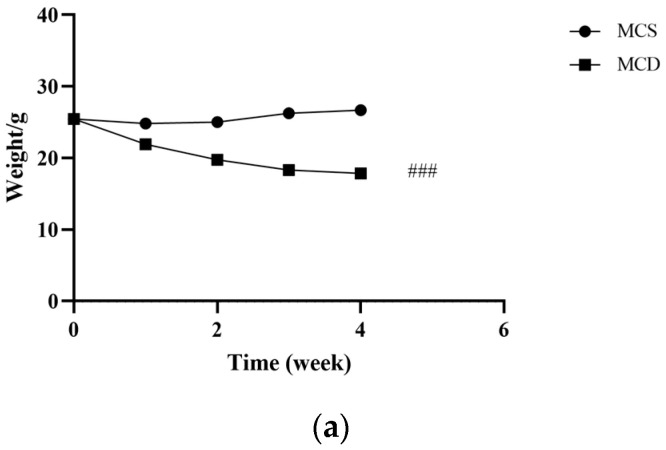
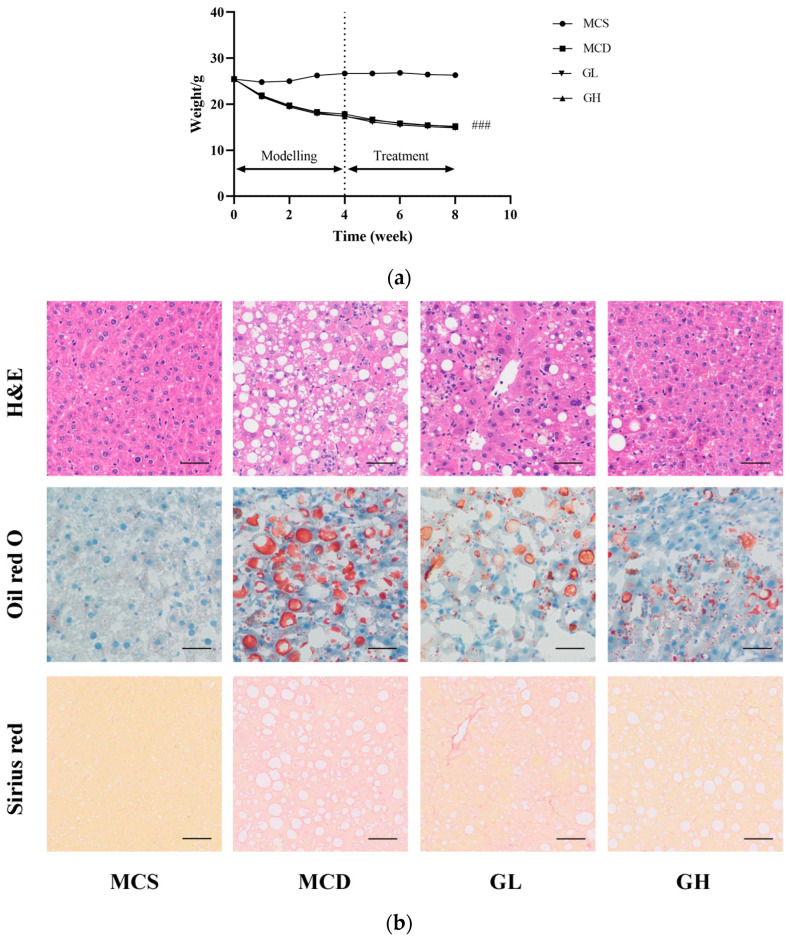
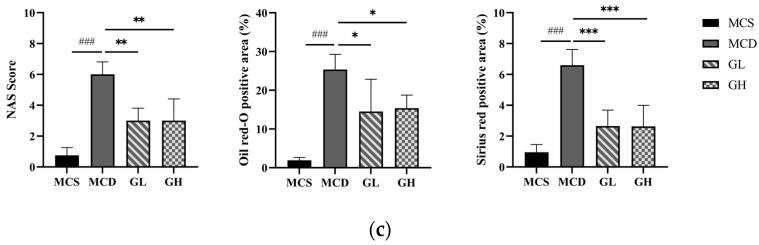
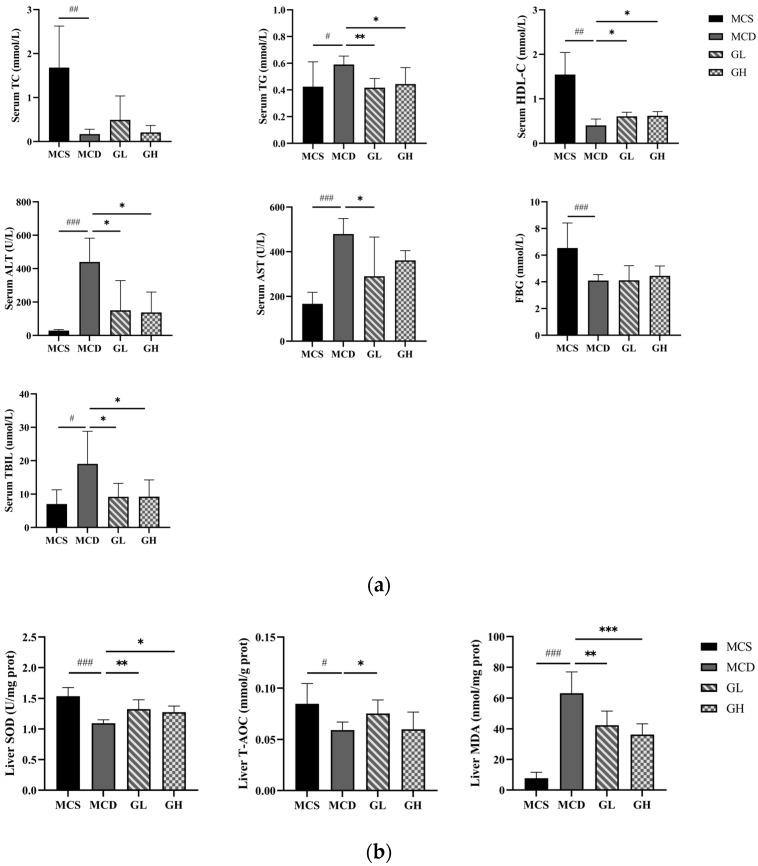
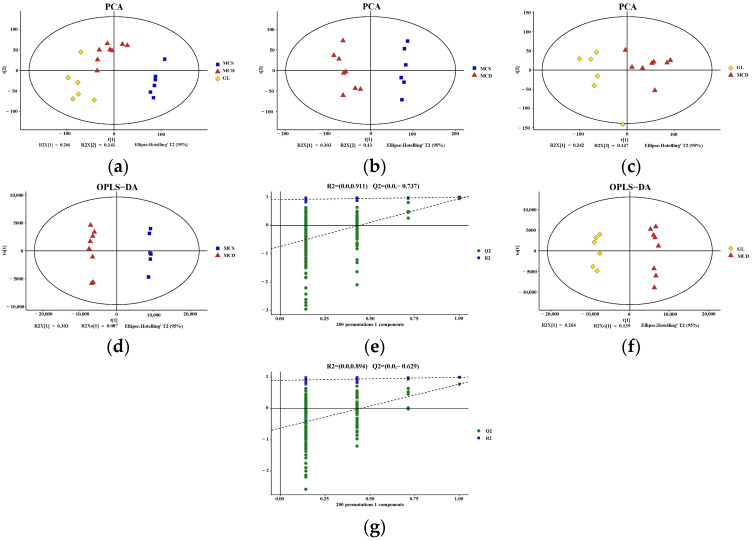
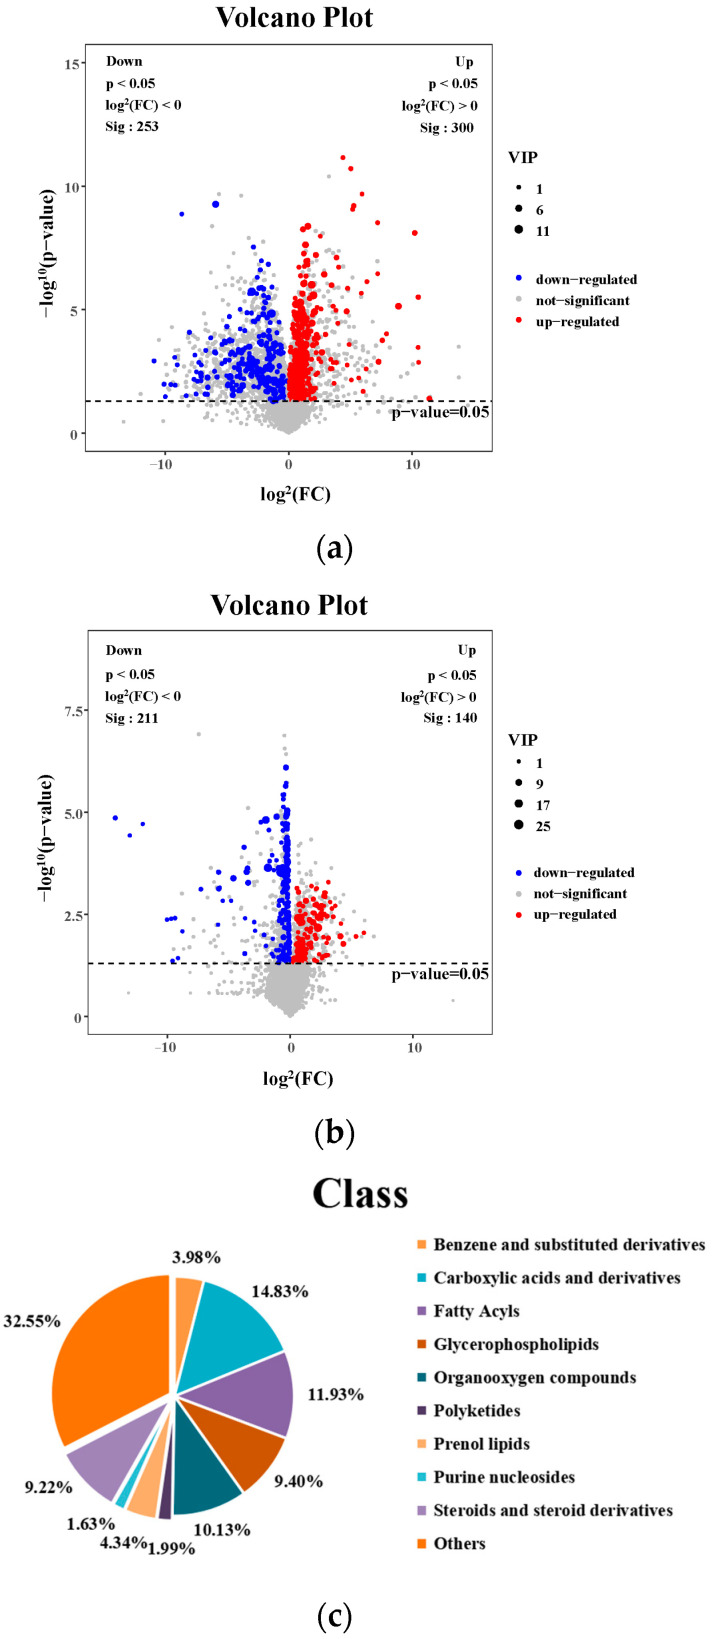
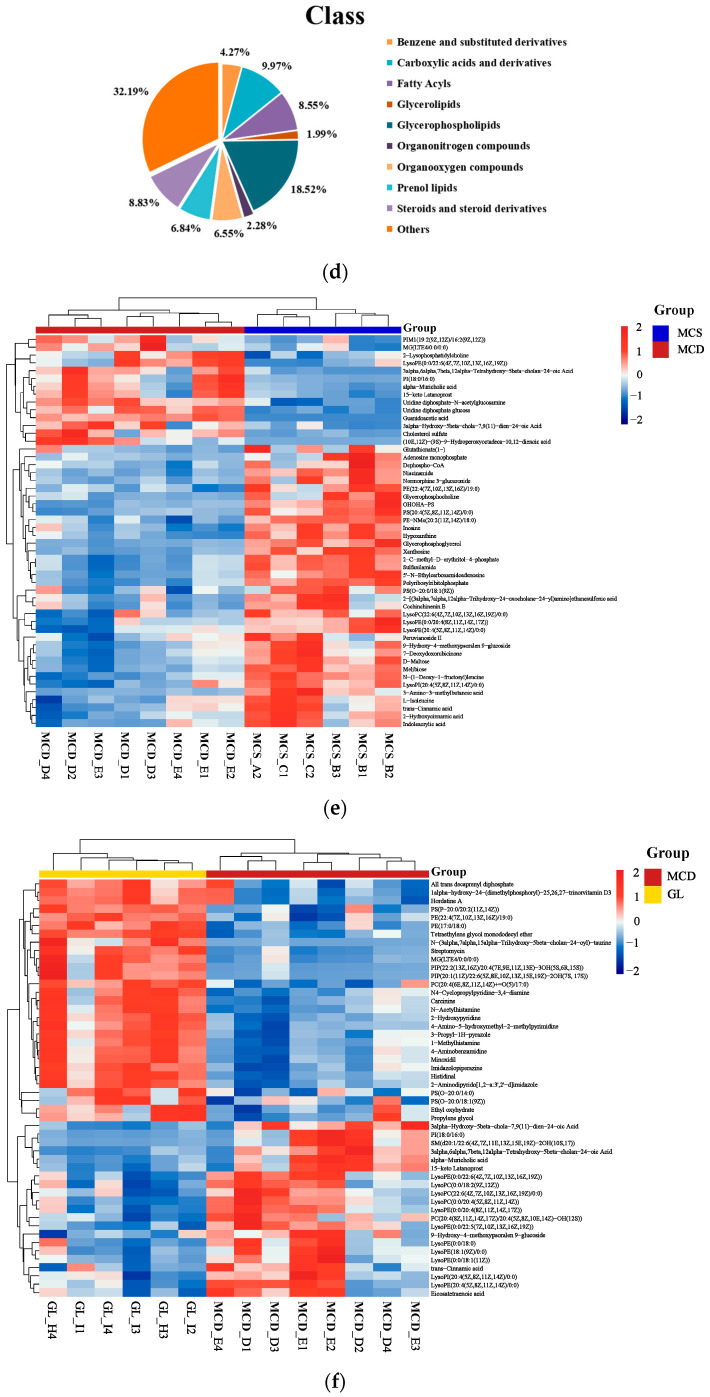
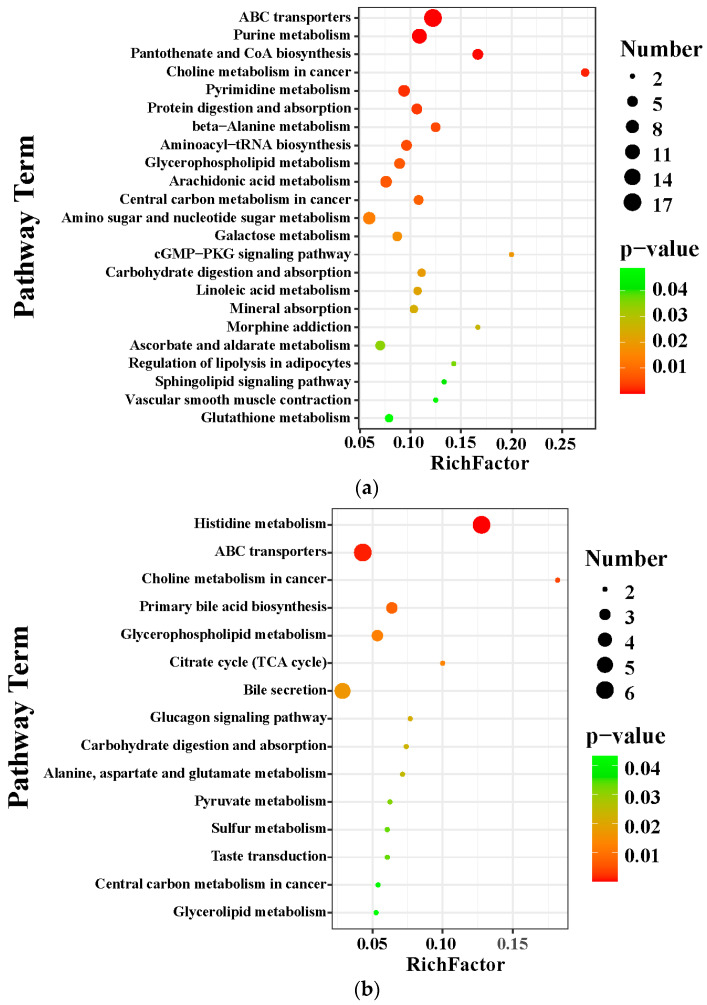
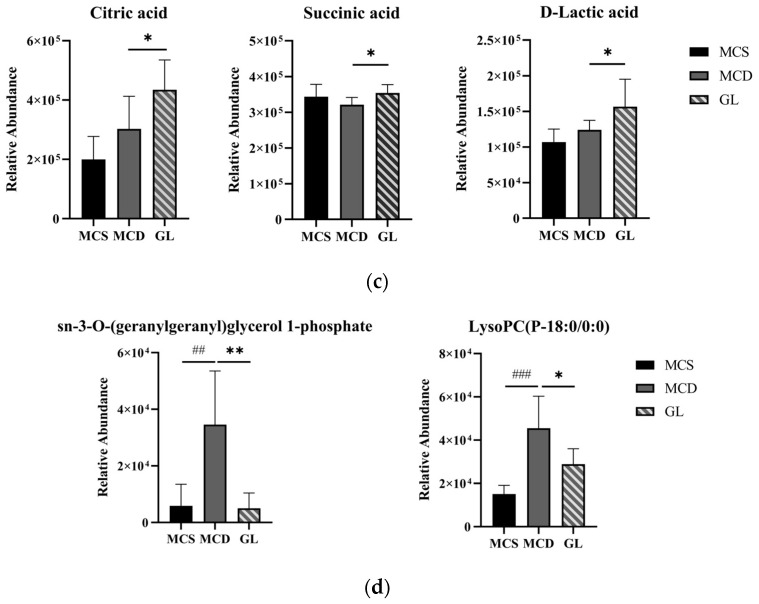
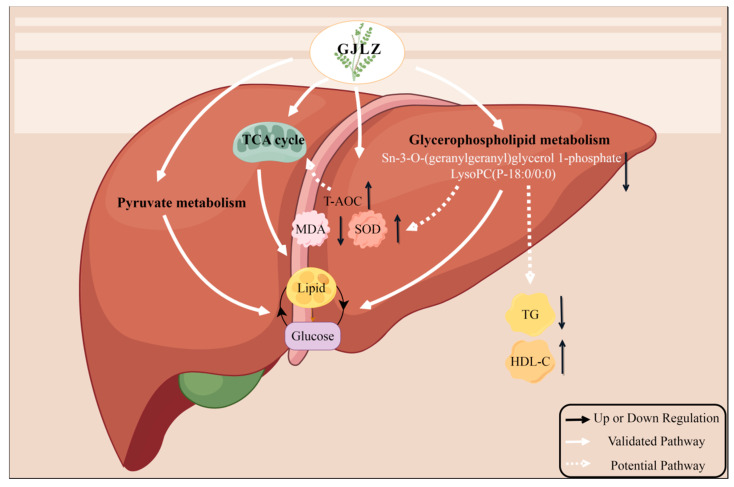
Non-alcoholic fatty liver disease (NAFLD) is usually associated with obesity. However, it is crucial to recognize that NAFLD can also occur in lean individuals, which is frequently overlooked. Without an approved pharmacological therapy for lean NAFLD, we aimed to investigate whether the Ganjianglingzhu (GJLZ) decoction, a representative traditional Chinese medicine (TCM), protects against lean NAFLD and explore the potential mechanism underlying these protective effects. The mouse model of lean NAFLD was established with a methionine-choline-deficient (MCD) diet in male C57BL/6 mice to be compared with the control group fed the methionine-choline-sufficient (MCS) diet. After four weeks, physiological saline, a low dose of GJLZ decoction (GL), or a high dose of GJLZ decoction (GH) was administered daily by gavage to the MCD group; the MCS group was given physiological saline by gavage. Untargeted metabolomics techniques were used to explore further the potential mechanism of the effects of GJLZ on lean NAFLD. Different doses of GJLZ decoction were able to ameliorate steatosis, inflammation, fibrosis, and oxidative stress in the liver; GL performed a better effect on lean NAFLD. In addition, 78 candidate differential metabolites were screened and identified. Combined with metabolite pathway enrichment analysis, GL was capable of regulating the glucose and lipid metabolite pathway in lean NAFLD and regulating the glycerophospholipid metabolism by altering the levels of sn-3-O-(geranylgeranyl)glycerol 1-phosphate and lysoPC(P-18:0/0:0). GJLZ may protect against the development of lean NAFLD by regulating glucose and lipid metabolism, inhibiting the levels of sn-3-O-(geranylgeranyl)glycerol 1-phosphate and lysoPC(P-18:0/0:0) in glycerophospholipid metabolism.

Keywords: Ganjianglingzhu decoction; glycerophospholipid metabolism; lean NAFLD.


Conflict of interest statement

The authors declare no conflicts of interest.

Figures

Figure 1
Figure 1
UPLC-Q-TOF/MS analysis of GJLZ decoction. (a) The base peak chromatogram of GJLZ decoction via UPLC-HRMS in negative ion mode. (b) The base peak chromatogram of GJLZ decoction via UPLC-HRMS in positive ion mode. (c) The UV chromatogram of GJLZ decoction at 280 nm. Each number of the peak was identified as the ingredient of GJLZ, the detail information is summarized in Table S3. GJLZ, Ganjianglingzhu.
Figure 1
Figure 1
UPLC-Q-TOF/MS analysis of GJLZ decoction. (a) The base peak chromatogram of GJLZ decoction via UPLC-HRMS in negative ion mode. (b) The base peak chromatogram of GJLZ decoction via UPLC-HRMS in positive ion mode. (c) The UV chromatogram of GJLZ decoction at 280 nm. Each number of the peak was identified as the ingredient of GJLZ, the detail information is summarized in Table S3. GJLZ, Ganjianglingzhu.
Figure 2
Figure 2
Evaluation of the lean NAFLD model in the fourth week. (a) Weight changes in the fourth week. (b) H&E staining of hepatic tissue (magnification 200×, the scale bar refers to 50 μm). (c) The levels of serum TC, TG, HDL-C, ALT, AST, and FBG. ALT, alanine transaminase; AST, aspartate transaminase; FBG, fasting blood glucose; HDL-C, high-density lipoprotein cholesterol; MCD, methionine-choline-deficient; MCS, methionine-choline-sufficient; NAFLD, non-alcoholic fatty liver disease; TC, total cholesterol; TG, triglyceride. # p < 0.050, ## p < 0.010 and ### p < 0.001: MCD group compared with the MCS group.
Figure 2
Figure 2
Evaluation of the lean NAFLD model in the fourth week. (a) Weight changes in the fourth week. (b) H&E staining of hepatic tissue (magnification 200×, the scale bar refers to 50 μm). (c) The levels of serum TC, TG, HDL-C, ALT, AST, and FBG. ALT, alanine transaminase; AST, aspartate transaminase; FBG, fasting blood glucose; HDL-C, high-density lipoprotein cholesterol; MCD, methionine-choline-deficient; MCS, methionine-choline-sufficient; NAFLD, non-alcoholic fatty liver disease; TC, total cholesterol; TG, triglyceride. # p < 0.050, ## p < 0.010 and ### p < 0.001: MCD group compared with the MCS group.
Figure 3
Figure 3
GJLZ ameliorated lean NAFLD induced by the MCD diet. (a) Weight changes in the four groups. (b) Representative images of hepatic H&E staining, Oil Red O staining, and Sirius Red staining (magnification 200×, the scale bar refers to 50 μm). (c) NAS score of liver and histomorphometric analysis of the positive area with Oil Red O staining and Sirius Red staining. GH, high dose of GJLZ; GJLZ, Ganjianglingzhu; GL, low dose of GJLZ; MCD, methionine-choline-deficient; MCS, methionine-choline-sufficient; NAFLD, non-alcoholic fatty liver disease; NAS, NAFLD activity score. ### p < 0.001: MCD group compared with the MCS group; * p < 0.050, ** p < 0.010 and *** p < 0.001: GL group and GH group compared with the MCD group.
Figure 3
Figure 3
GJLZ ameliorated lean NAFLD induced by the MCD diet. (a) Weight changes in the four groups. (b) Representative images of hepatic H&E staining, Oil Red O staining, and Sirius Red staining (magnification 200×, the scale bar refers to 50 μm). (c) NAS score of liver and histomorphometric analysis of the positive area with Oil Red O staining and Sirius Red staining. GH, high dose of GJLZ; GJLZ, Ganjianglingzhu; GL, low dose of GJLZ; MCD, methionine-choline-deficient; MCS, methionine-choline-sufficient; NAFLD, non-alcoholic fatty liver disease; NAS, NAFLD activity score. ### p < 0.001: MCD group compared with the MCS group; * p < 0.050, ** p < 0.010 and *** p < 0.001: GL group and GH group compared with the MCD group.
Figure 4
Figure 4
Serum index and liver oxidative stress index among the four groups. (a) The levels of serum TC, TG, HDL-C, ALT, AST, FBG, and TBIL. (b) The levels of liver SOD, T-AOC, and MDA. ALT, alanine transaminase; AST, aspartate transaminase; FBG, fasting blood glucose; GH, high dose of GJLZ; GJLZ, Ganjianglingzhu; GL, low dose of GJLZ; HDL-C, high-density lipoprotein cholesterol; MCD, methionine-choline-deficient; MCS, methionine-choline-sufficient; MDA, malondialdehyde; SOD, superoxide dismutase; TBIL, total bilirubin; TC, total cholesterol; TG, triglyceride; T-AOC, total antioxidant capacity. # p < 0.050, ## p < 0.010 and ### p < 0.001: MCD group compared with the MCS group; * p < 0.050, ** p < 0.010 and *** p < 0.001: GL group and GH group compared with the MCD group.
Figure 5
Figure 5
Quality control of the metabolomics data. (a) PCA score plot among the three groups. PCA showed a clear group separation between the three groups. (b) PCA score plot shows the metabolic state difference between the MCS group and the MCD group. (c) PCA score plot showing the difference in the metabolic state between the GL group and MCD group. (d,e) Score plots of OPLS-DA between the MCS group and the MCD model group and the corresponding coefficient of loading plots. The OPLS-DA models indicated significant metabolic variations between the MCS group and the MCD group. (f,g) Score plots of OPLS-DA between the GL group and the MCD group and the corresponding coefficient of loading plots. The OPLS-DA models indicated significant metabolic variations between the GL group and the MCD group. GJLZ, Ganjianglingzhu; GL, low dose of GJLZ; MCD, methionine-choline-deficient; MCS, methionine-choline-sufficient; OPLS-DA, orthogonal partial least-squares-discriminant analysis; PCA, principal component analysis.
Figure 6
Figure 6
Analysis of different metabolites among three groups. (a) Volcano plot for differential metabolites in MCS vs. MCD. (b) Volcano plot for differential metabolites in GL vs. MCD. (c) Classification of differential metabolites between MCS and MCD groups. (d) Classification of differential metabolites between MCD and GL groups. (e) Hierarchical cluster analysis heat map of top 50 liver content metabolites in MCS vs. MCD. (f) Hierarchical cluster analysis heat map of top 50 liver content metabolites in GL vs. MCD. GJLZ, Ganjianglingzhu; GL, low dose of GJLZ; MCD, methionine-choline-deficient; MCS, methionine-choline-sufficient; VIP, variable importance of projection.
Figure 6
Figure 6
Analysis of different metabolites among three groups. (a) Volcano plot for differential metabolites in MCS vs. MCD. (b) Volcano plot for differential metabolites in GL vs. MCD. (c) Classification of differential metabolites between MCS and MCD groups. (d) Classification of differential metabolites between MCD and GL groups. (e) Hierarchical cluster analysis heat map of top 50 liver content metabolites in MCS vs. MCD. (f) Hierarchical cluster analysis heat map of top 50 liver content metabolites in GL vs. MCD. GJLZ, Ganjianglingzhu; GL, low dose of GJLZ; MCD, methionine-choline-deficient; MCS, methionine-choline-sufficient; VIP, variable importance of projection.
Figure 7
Figure 7
Metabolite pathway enrichment analysis. (a) KEGG pathway enrichment analysis between the MCS group and the MCD group. (b) KEGG pathway enrichment analysis between the GL group and the MCD group. (c) After treatment with GL, the specific differential metabolites in the tricarboxylic acid cycle, glucagon signaling pathway, alanine, aspartate and glutamate metabolism, and pyruvate metabolism. (d) In the glycerophospholipid metabolism pathway, sn-3-O-(geranylgeranyl)glycerol 1-phosphate and LysoPC(P-18:0/0:0) were all higher in the MCD group than in the MCS and GL groups. GJLZ, Ganjianglingzhu; GL, low dose of GJLZ; MCD, methionine-choline-deficient; MCS, methionine-choline-sufficient. ## p < 0.010 and ### p < 0.001: MCD group compared with the MCS group; * p < 0.050, and ** p < 0.01: GL group compared with the MCD group.
Figure 7
Figure 7
Metabolite pathway enrichment analysis. (a) KEGG pathway enrichment analysis between the MCS group and the MCD group. (b) KEGG pathway enrichment analysis between the GL group and the MCD group. (c) After treatment with GL, the specific differential metabolites in the tricarboxylic acid cycle, glucagon signaling pathway, alanine, aspartate and glutamate metabolism, and pyruvate metabolism. (d) In the glycerophospholipid metabolism pathway, sn-3-O-(geranylgeranyl)glycerol 1-phosphate and LysoPC(P-18:0/0:0) were all higher in the MCD group than in the MCS and GL groups. GJLZ, Ganjianglingzhu; GL, low dose of GJLZ; MCD, methionine-choline-deficient; MCS, methionine-choline-sufficient. ## p < 0.010 and ### p < 0.001: MCD group compared with the MCS group; * p < 0.050, and ** p < 0.01: GL group compared with the MCD group.
Figure 8
Figure 8
The mechanisms underlying the therapeutic effects of GJLZ in treating lean NAFLD. GJLZ, Ganjianglingzhu; HDL-C, high-density lipoprotein cholesterol; MDA, malondialdehyde; NALFD, non-alcoholic fatty liver disease; SOD, superoxide dismutase; TCA cycle, tricarboxylic acid cycle; TG, triglyceride; T-AOC, total antioxidant capacity. The cartoon components originated from www.figdraw.com for model drawing (accessed on 28 November 2023).

Similar articles

Cited by

References

    1. Riazi K., Azhari H., Charette J.H., Underwood F.E., King J.A., Afshar E.E., Swain M.G., Congly S.E., Kaplan G.G., Shaheen A.-A. The prevalence and incidence of NAFLD worldwide: A systematic review and meta-analysis. Lancet Gastroenterol. Hepatol. 2022;7:851–861. doi: 10.1016/S2468-1253(22)00165-0. - DOI - PubMed
    1. Friedman S.L., Neuschwander-Tetri B.A., Rinella M., Sanyal A.J. Mechanisms of NAFLD development and therapeutic strategies. Nat. Med. 2018;24:908–922. doi: 10.1038/s41591-018-0104-9. - DOI - PMC - PubMed
    1. Chalasani N., Younossi Z., Lavine J.E., Charlton M., Cusi K., Rinella M., Harrison S.A., Brunt E.M., Sanyal A.J. The diagnosis and management of nonalcoholic fatty liver disease: Practice guidance from the American Association for the Study of Liver Diseases. Hepatology. 2017;67:328–357. doi: 10.1002/hep.29367. - DOI - PubMed
    1. Zou Z.Y., Wong V.W.S., Fan J.G. Epidemiology of nonalcoholic fatty liver disease in non-obese populations: Meta-analytic assessment of its prevalence, genetic, metabolic, and histological profiles. J. Dig. Dis. 2020;21:372–384. doi: 10.1111/1751-2980.12871. - DOI - PubMed
    1. Ahadi M., Molooghi K., Masoudifar N., Namdar A.B., Vossoughinia H., Farzanehfar M. A review of non-alcoholic fatty liver disease in non-obese and lean individuals. J. Gastroenterol. Hepatol. 2020;36:1497–1507. doi: 10.1111/jgh.15353. - DOI - PubMed

LinkOut - more resources