

Onosma bracteatum Wall Aqueous-Ethanolic Extract Suppresses Complete Freund's Adjuvant-Induced Arthritis in Rats via Regulation of TNF-α, IL-6, and C-Reactive Protein
- PMID: 38675650
- PMCID: PMC11052358
- DOI: 10.3390/molecules29081830
Onosma bracteatum Wall Aqueous-Ethanolic Extract Suppresses Complete Freund's Adjuvant-Induced Arthritis in Rats via Regulation of TNF-α, IL-6, and C-Reactive Protein
Abstract
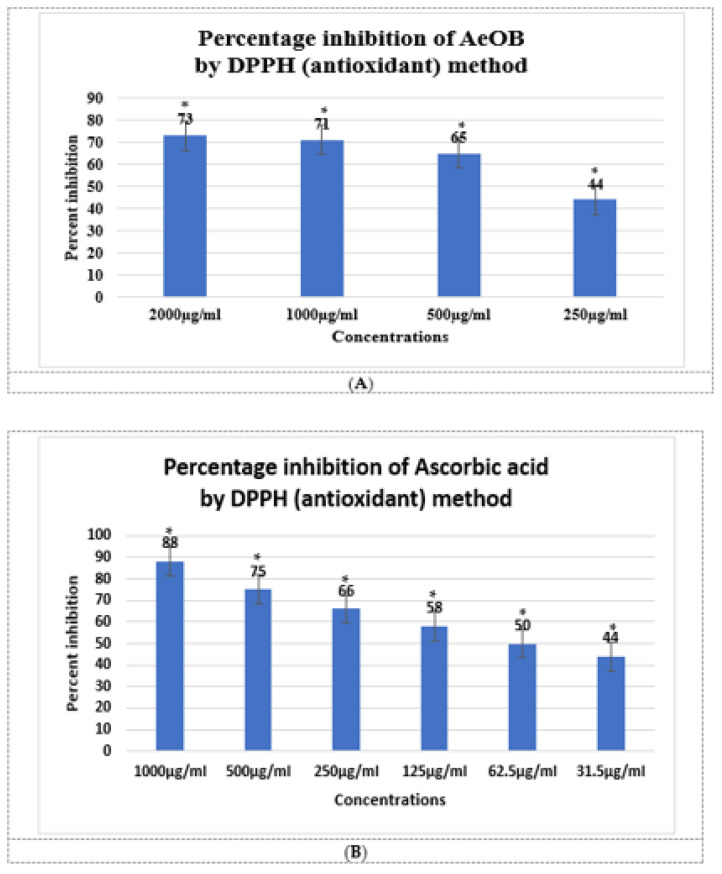
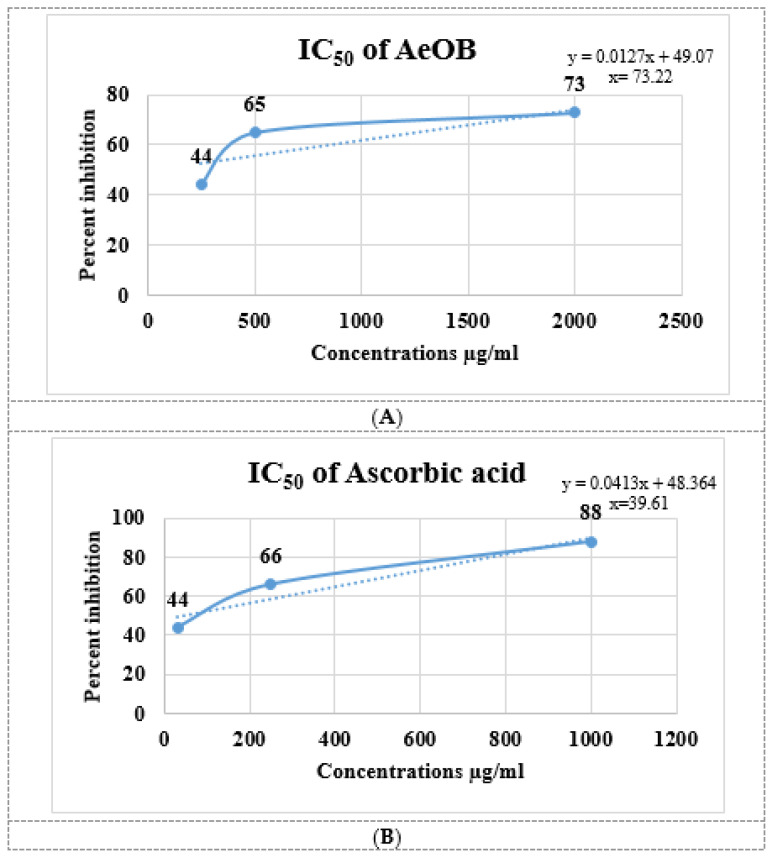
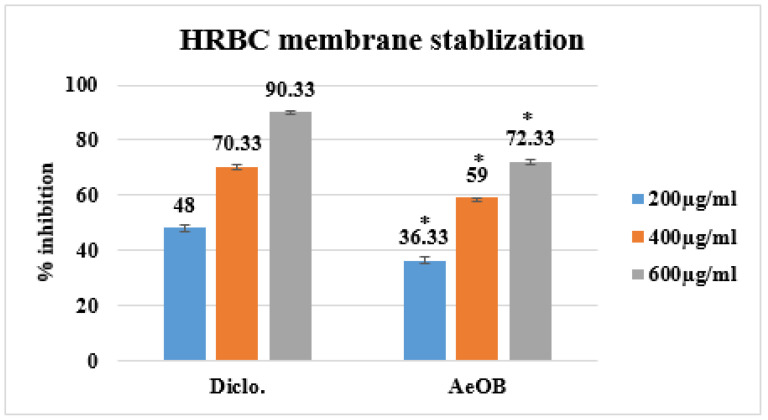
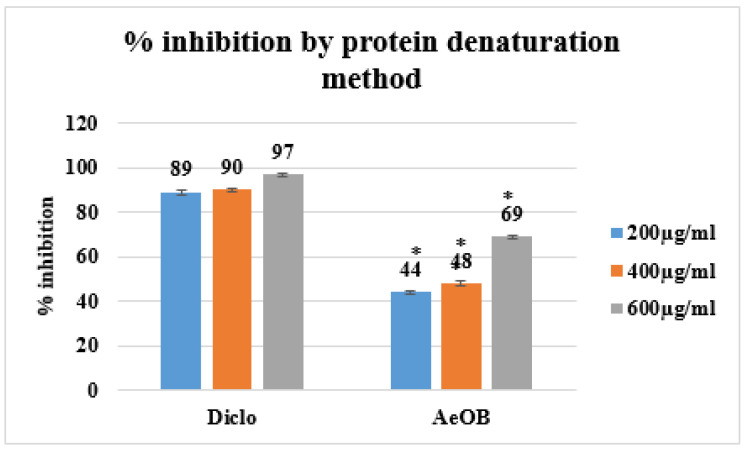
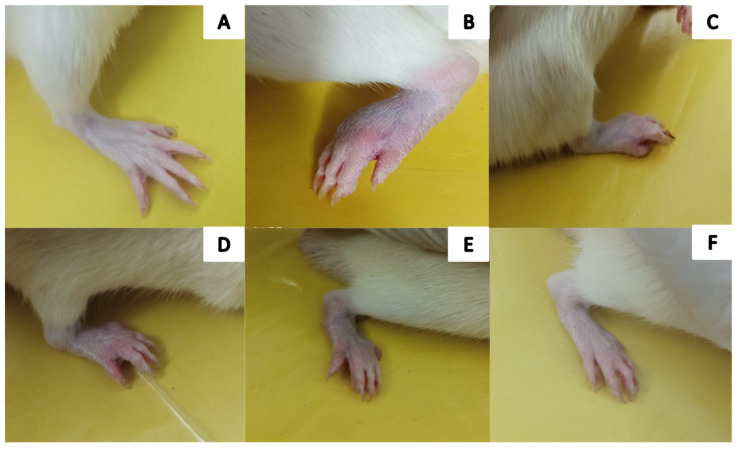
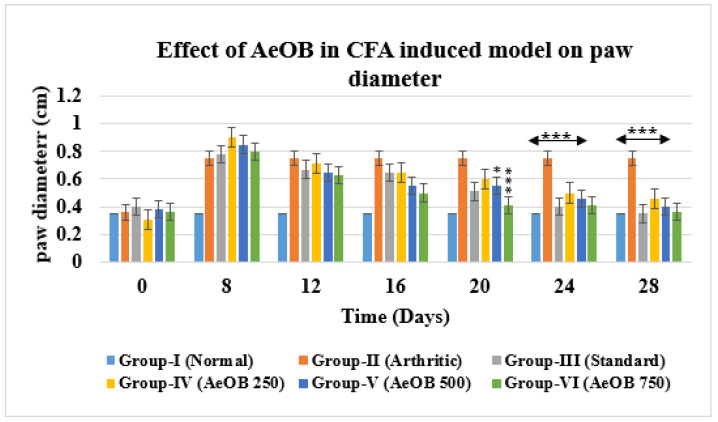
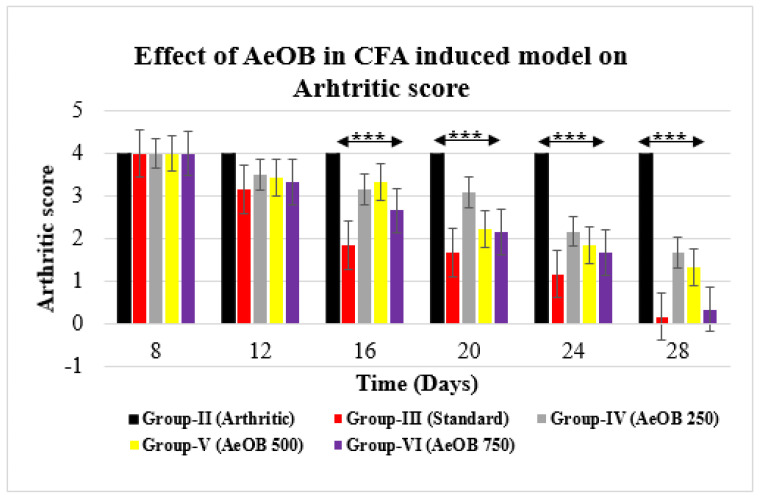
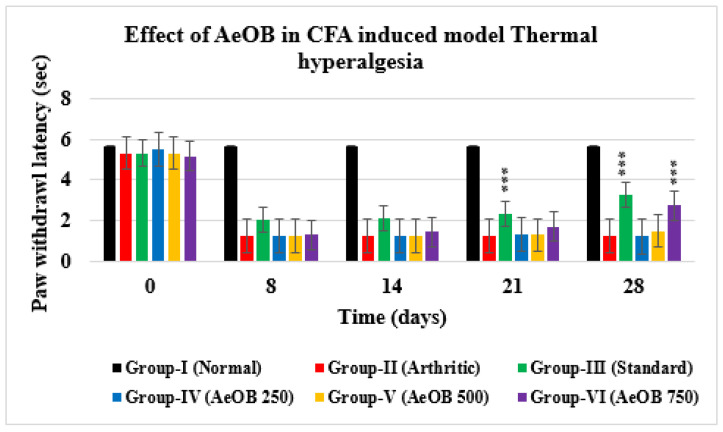
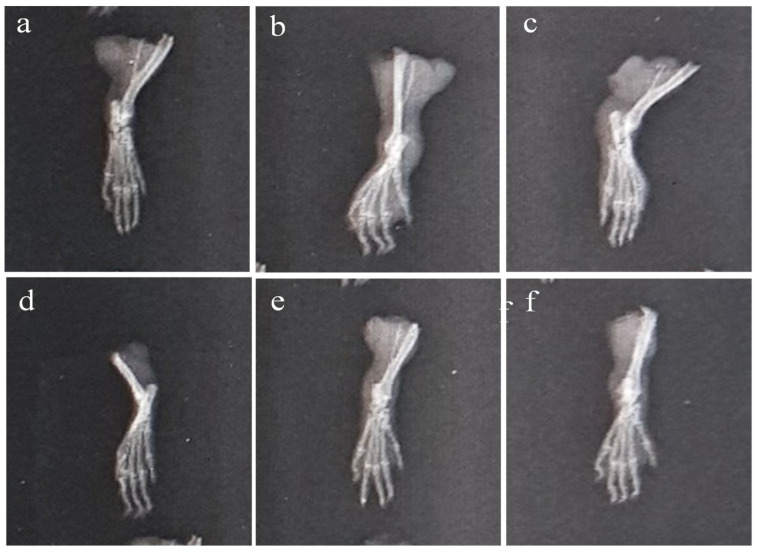
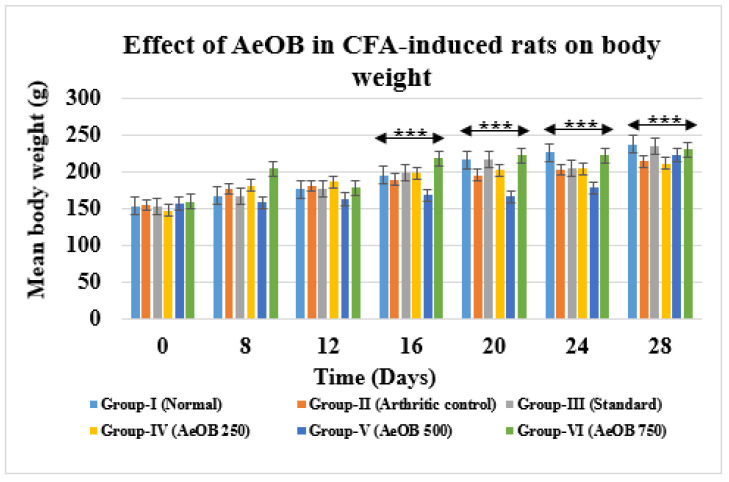
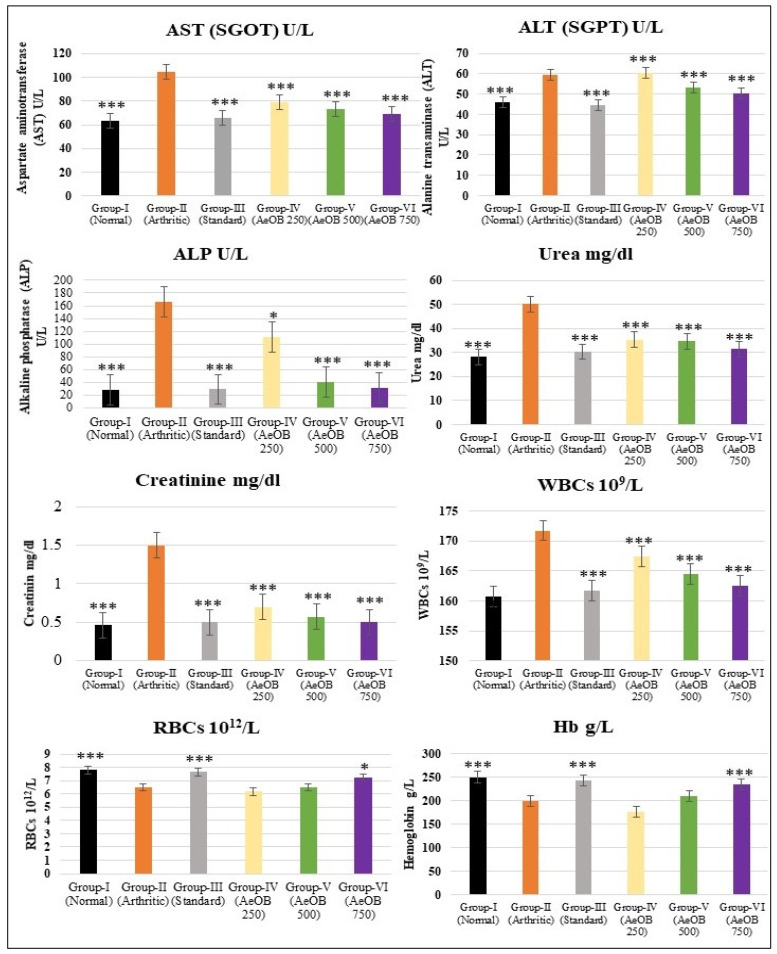
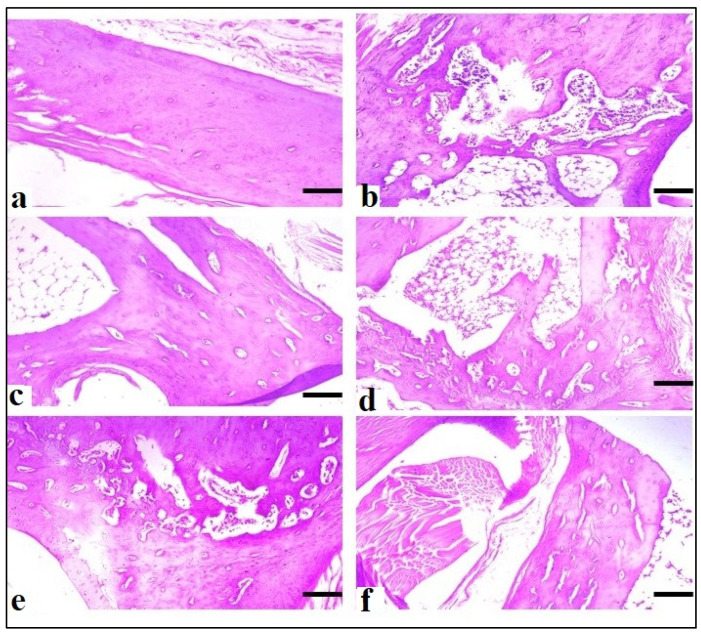
Onosma bracteatum Wall (O. bracteatum) has been used traditionally for the management of arthritis; however, its therapeutic potential warrants further investigation. This study aimed to evaluate the anti-arthritic effects of the aqueous-ethanolic extract of O. bracteatum leaves (AeOB) in a rat model of complete Freund's adjuvant (CFA)-induced arthritis. Rats were treated with AeOB (250, 500, and 750 mg/kg), indomethacin (10 mg/kg), or a vehicle control from days 8 to 28 post-CFA injection. Arthritic score, paw diameter, and body weight were monitored at regular intervals. X-ray radiographs and histopathological analysis were performed to assess arthritic severity. Inflammatory cytokines tumor necrosis factor-alpha (TNF-α), interleukin-6 (IL-6), and C-reactive protein (CRP) were quantified by qPCR and icromatography. Phytochemical analysis of AeOB revealed alkaloids, flavonoids, phenols, tannins, Saponins, and glycosides. AeOB also exhibited antioxidant potential with an IC50 of 73.22 µg/mL in a DPPH assay. AeOB and diclofenac exhibited anti-inflammatory and anti-arthritic activities. Rats treated with AeOB at 750 mg/kg and indomethacin showed significantly reduced arthritic symptoms and joint inflammation versus the CFA control. The AeOB treatment downregulated TNF-α and IL-6 and decreased CRP levels compared with arthritic rats. Radiography and histopathology also showed improved prognosis. These findings demonstrate the anti-arthritic potential of AeOB leaves.
Keywords: CFA; Onosma bracteatum wall; arthritis; inflammatory mediators; qRT-PCR.
Conflict of interest statement
The authors declare no conflicts of interest.
Figures
Similar articles
-
Ephedra gerardiana aqueous ethanolic extract and fractions attenuate Freund Complete Adjuvant induced arthritis in Sprague Dawley rats by downregulating PGE2, COX2, IL-1β, IL-6, TNF-α, NF-kB and upregulating IL-4 and IL-10.J Ethnopharmacol. 2018 Oct 5;224:482-496. doi: 10.1016/j.jep.2018.06.018. Epub 2018 Jun 18. J Ethnopharmacol. 2018. PMID: 29920358
-
Amelioration of adjuvant induced arthritis in Sprague Dawley rats through modulation of inflammatory mediators by Ribes alpestre Decne.J Ethnopharmacol. 2019 May 10;235:460-471. doi: 10.1016/j.jep.2019.02.025. Epub 2019 Feb 13. J Ethnopharmacol. 2019. PMID: 30771518
-
Inhibitory effects of Clematis orientalis aqueous ethanol extract and fractions on inflammatory markers in complete Freund's adjuvant-induced arthritis in Sprague-Dawley rats.Inflammopharmacology. 2019 Aug;27(4):781-797. doi: 10.1007/s10787-018-0543-4. Epub 2018 Nov 16. Inflammopharmacology. 2019. PMID: 30446927
-
Protective effect of Tecoma stans (L.) Juss.ex Kunth in CFA-induced arthritic rats.J Ethnopharmacol. 2025 Jan 30;337(Pt 3):118944. doi: 10.1016/j.jep.2024.118944. Epub 2024 Oct 16. J Ethnopharmacol. 2025. PMID: 39423943
-
Mechanistic insights into anti-inflammatory and immunosuppressive effects of plant secondary metabolites and their therapeutic potential for rheumatoid arthritis.Phytother Res. 2024 Jun;38(6):2931-2961. doi: 10.1002/ptr.8147. Epub 2024 Apr 10. Phytother Res. 2024. PMID: 38600726 Review.
Cited by
-
Immunomodulatory properties of a methanolic extract of Ficus lyrata mitigate inflammation in Complete Freund's Adjuvant-induced arthritis.Inflammopharmacology. 2025 Apr;33(4):1921-1934. doi: 10.1007/s10787-025-01700-6. Epub 2025 Mar 26. Inflammopharmacology. 2025. PMID: 40140117
-
Extraction and Analysis of Antimicrobial Compounds from Onosma Bracteatum Using Response Surface Methodology.J Pharm Bioallied Sci. 2025 May;17(Suppl 1):S865-S868. doi: 10.4103/jpbs.jpbs_1595_24. Epub 2025 Feb 15. J Pharm Bioallied Sci. 2025. PMID: 40510997 Free PMC article.
References
-
- Anyfanti P., Triantafyllou A., Panagopoulos P., Triantafyllou G., Pyrpasopoulou A., Chatzimichailidou S., Koletsos N., Botis I., Aslanidis S., Douma S. Predictors of impaired quality of life in patients with rheumatic diseases. Clin. Rheumatol. 2016;35:1705–1711. doi: 10.1007/s10067-015-3155-z. - DOI - PubMed
-
- Akhter S., Irfan H.M., Alamgeer, Jahan S., Shahzad M., Latif M.B. Nerolidol: A potential approach in rheumatoid arthritis through reduction of TNF-α, IL-1β, IL-6, NF-kB, COX-2 and antioxidant effect in CFA-induced arthritic model. Inflammopharmacology. 2022;30:537–548. doi: 10.1007/s10787-022-00930-2. - DOI - PubMed
-
- Uttra A.M., Shahzad M., Shabbir A., Jahan S. Ephedra gerardiana aqueous ethanolic extract and fractions attenuate Freund Complete Adjuvant induced arthritis in Sprague Dawley rats by downregulating PGE2, COX2, IL-1β, IL-6, TNF-α, NF-kB and upregulating IL-4 and IL-10. J. Ethnopharmacol. 2018;224:482–496. doi: 10.1016/j.jep.2018.06.018. - DOI - PubMed
MeSH terms
Substances
LinkOut - more resources
Full Text Sources
Research Materials
Miscellaneous
