. 2024 Apr 15;16(4):611.
doi: 10.3390/v16040611.

Natural Killer Cells Do Not Attenuate a Mouse-Adapted SARS-CoV-2-Induced Disease in Rag2-/- Mice

Affiliations

Natural Killer Cells Do Not Attenuate a Mouse-Adapted SARS-CoV-2-Induced Disease in Rag2-/- Mice

Calder R Ellsworth et al. Viruses. .

Abstract

This study investigates the roles of T, B, and Natural Killer (NK) cells in the pathogenesis of severe COVID-19, utilizing mouse-adapted SARS-CoV-2-MA30 (MA30). To evaluate this MA30 mouse model, we characterized MA30-infected C57BL/6 mice (B6) and compared them with SARS-CoV-2-WA1 (an original SARS-CoV-2 strain) infected K18-human ACE2 (K18-hACE2) mice. We found that the infected B6 mice developed severe peribronchial inflammation and rapid severe pulmonary edema, but less lung interstitial inflammation than the infected K18-hACE2 mice. These pathological findings recapitulate some pathological changes seen in severe COVID-19 patients. Using this MA30-infected mouse model, we further demonstrate that T and/or B cells are essential in mounting an effective immune response against SARS-CoV-2. This was evident as Rag2-/- showed heightened vulnerability to infection and inhibited viral clearance. Conversely, the depletion of NK cells did not significantly alter the disease course in Rag2-/- mice, underscoring the minimal role of NK cells in the acute phase of MA30-induced disease. Together, our results indicate that T and/or B cells, but not NK cells, mitigate MA30-induced disease in mice and the infected mouse model can be used for dissecting the pathogenesis and immunology of severe COVID-19.

Keywords: B cells; COVID-19; MA30; NK cells; SARS-CoV-2; T cells.


Conflict of interest statement

The authors declare no conflicts of interest.

Figures
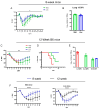
Figure 1
Figure 1
Dose-dependent effects of MA30 infection in B6 mice: (A) Body weight changes in 8-week-old mice infected with medium (Med) and low (Low) doses (n = 4 mice/group). p = 0.0248, comparing the body weight (BW) changes between the groups by two-way ANOVA analysis. (B) Viral subgenomic N RNA in the infected 8-week-old mice (from A) was measured using qPCR. (C) Body weight changes after the infection. ** p = 0.0051 (n = 5 per group) derived from comparing low- vs. medium-dose groups by mixed-effects analysis. (D) Survival rates over 10 days post infection (DPI) for each group (n = 5/group). The log-rank (Mantel-Cox) test showed a p-value of 0.0104. (E) Viral subgenomic N RNA was quantified through qPCR. The y-axis represents normalized values (log10 copies per 100 ng). Twelve-week-old B6 mice (shown in CE) were divided into three groups and intranasally inoculated with three different doses of CoV2-MA30: high (2 × 10⁵ TCID50), medium (5 × 10⁴ TCID50) (Med), and low (1 × 10⁴ TCID50). Data from the high-dose group were derived from an independent experiment. (F) Body weight differences between the 8-week-old and 12-week-old mice infected with both medium and low doses of MA30. **** p < 0.0001 was analyzed by mixed-effects analysis for the left panel or two-way ANOVA analyses for the right panel (n = 4/group). * p < 0.05 was analyzed by using Sidak’s multiple comparisons.
Figure 2
Figure 2
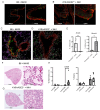
Viral tropisms and lung pathological changes in MA30 infected B6 and CoV2-infected K18-hACE2+/− mice. Twenty-week-old B6 and K18-hACE2 mice shown in (AE) were intranasally infected with CoV2 MA30 (5 × 10⁴ TCID50) and CoV2 MA1 (1 × 10⁴ TCID50), respectively. (A,B) Epithelial cell infection of the nasal turbinates in the infected B6 (A) and K18-hACE2 mice (B) at 3 DPI. (C,D) Epithelial cell infection in the bronchus and bronchioles of CoV-2 MA30-infected B6 mice at 3 DPI (C) and in the alveoli’s epithelial cells of the WA1-infected K18-hACE2 mice at DPI (D). Cross-sections of the nasal turbinate and lung from a 20-week-old B6 mouse and a K18-hACE2 mouse. Immunostaining with the anti-cytokeratin marker in red and the anti-SARS-CoV-2 N protein in green. (E) Viral tropism was assessed by quantifying infected cells within the bronchial epithelium (left panel, E) and lung alveoli (right panel, E) of the infected mice (n = 3 mice per group). Viral infection was significant in the bronchial epithelium but not the alveoli, as indicated by unpaired t-test (p = 0.0100 and 0.1040, respectively). (F) Extensive edema in the lungs of infected B6 mice via hematoxylin and eosin (H/E) staining. (G) Extensive inflammation seen in the infected K18-hACE2 mice. (H) Quantitative analysis of lung histological changes in the infected mice (n = 9 B6 at 3 DPI, n = 3 K18-hACE2 at 3 DPI, n = 6 B6 at 5–6 DPI, n = 12 at 5–6 DPI). Mouse lung tissues shown in (FG) were collected from multiple experiments with K18-hACE2 male and female mice infected with 2.0 × 10⁵ PFU/mouse, and B6 mice infected with the high dose of 5 × 10⁴ TCID50. Pattern recognition algorithms were used to quantify the percentage of lung area affected by inflammation or edema. * p < 0.05.
Figure 3
Figure 3
Rag2 deficiency accelerates body weight loss and sustains viral load. B6 and Rag2−/− 8-week-old mice were intranasally infected with a medium (Med) and low (Low) dose of CoV2-MA30 and monitored for 15 DPI (B6 Med, n = 4; Rag2−/− med, n = 4; B6 Low, n = 5; Rag2−/− low, n = 4). (A) Body weight changes in the infected Rag2−/− and B6 mice. p < 0.0001, comparing BW combined by medium- and low-dose groups by three-way ANOVA. (B) Viral subgenomic RNA in the mice. Viral subgenomic N RNA was measured through qPCR, and significant difference was found between Rag2−/− and B6 groups in both medium- (p = 0.0002) and low-dose (p < 0.0001) groups, using unpaired t-test. (C) Viral subgenomic N RNA detection in multiple extra-pulmonary tissues, including the brain, spleen, and kidney. (D,E) Viral infection detected via viral S protein staining. Anti-SARS S protein antibody in green. Representative images of viral S staining of B6 and Rag2−/− mice infected with the medium dose of CoV2-MA30 at DPI 15. (E) Quantification of viral S protein positive cells in the lungs of all medium-dose and some low-dose mice with p-value 0.0019 from two-tailed unpaired t-test (n = 7 B6, n = 5 Rag2−/−). ** p < 0.01, *** p < 0.001, **** p < 0.0001.
Figure 4
Figure 4
Transcriptomic analysis of the lungs of the infected Rag2−/− and B6 (Rag2+/+) mice: Bulk RNA seq analyses were conducted on the lungs of the infected 14-week-old Rag2−/− (n = 3) and B6 males (n = 3) at 3 days post-infection (DPI) by MA30 (5 × 10⁴ TCID50). Differentially expressed genes (DEGs) were generated by Cuffdiff and EdgeR (p < 0.05). (A) Dot plot of changed pathways in the lungs of Rag2−/− mice as compared to B6 mice. EdgeR DEGs (Table S1) were used for ShinyGo 0.80 gene enrichment analysis (need to cite: ShinyGO: a graphical gene-set enrichment tool for animals and plants). (B) Volcano plot showing fold-change and p-value of DEGs between Rag2−/− mice and B6 mice generated by Cuffdiff (Table S2). Key genes involved in primary immunodeficiency pathway, B cell and T cell receptor signaling pathways, Th1, Th2, and Th17 cell differentiation pathways, and interferon response genes are indicated with black line.
Figure 5
Figure 5
The depletion of NK cells in Rag2−/− mice did not impact MA30-induced diseases. Eighteen-week-old male Rag2−/− mice were infected with medium dose of MA30 (2 × 10⁴ TCID50) and treated with either anti-NK or the isotype control (n = 5/group). (A) Body weight (BW) changes in the mice. The infected mice were monitored for 8 DPI and no difference was found using two-way ANOVA. (B) Survival rate in the mice. No difference was found in the mice using log-rank (Mantel-Cox) test. (C) Viral subgenomic N RNA analysis. No difference was found in viral subgenomic N RNA of the mice. (D) Lung histological changes. Representative images show comparable edema between anti-NK1.1 treated and control groups. (E) Quantitative analysis of edema. There is no significant difference found between them using unpaired t-test.

References

    1. Hadj Hassine I. COVID-19 vaccines and variants of concern: A review. Rev. Med. Virol. 2022;32:e2313. doi: 10.1002/rmv.2313. - DOI - PMC - PubMed
    1. Fernandes Q., Inchakalody V.P., Merhi M., Mestiri S., Taib N., Moustafa Abo El-Ella D., Bedhiafi T., Raza A., Al-Zaidan L., Mohsen M.O., et al. Emerging COVID-19 variants and their impact on SARS-CoV-2 diagnosis, therapeutics and vaccines. Ann. Med. 2022;54:524–540. doi: 10.1080/07853890.2022.2031274. - DOI - PMC - PubMed
    1. Zeng B., Gao L., Zhou Q., Yu K., Sun F. Effectiveness of COVID-19 vaccines against SARS-CoV-2 variants of concern: A systematic review and meta-analysis. BMC Med. 2022;20:200. doi: 10.1186/s12916-022-02397-y. - DOI - PMC - PubMed
    1. Diamond M.S., Kanneganti T.-D. Innate immunity: The first line of defense against SARS-CoV-2. Nat. Immunol. 2022;23:165–176. doi: 10.1038/s41590-021-01091-0. - DOI - PMC - PubMed
    1. Malahe S.R.K., Hoek R.A.S., Dalm V., Broers A.E.C., den Hoed C.M., Manintveld O.C., Baan C.C., van Deuzen C.M., Papageorgiou G., Bax H.I., et al. Clinical Characteristics and Outcomes of Immunocompromised Patients with Coronavirus Disease 2019 Caused by the Omicron Variant: A Prospective, Observational Study. Clin. Infect. Dis. 2023;76:e172–e178. doi: 10.1093/cid/ciac571. - DOI - PMC - PubMed

Publication types

MeSH terms

Substances