

Pupil Response in Visual Tracking Tasks: The Impacts of Task Load, Familiarity, and Gaze Position
- PMID: 38676162
- PMCID: PMC11054646
- DOI: 10.3390/s24082545
Pupil Response in Visual Tracking Tasks: The Impacts of Task Load, Familiarity, and Gaze Position
Abstract
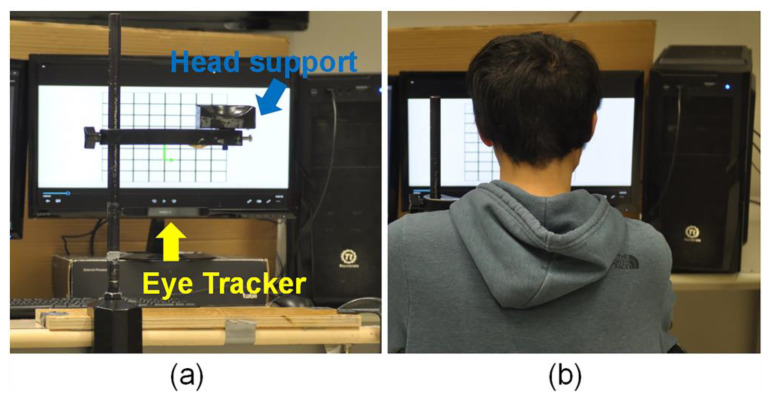
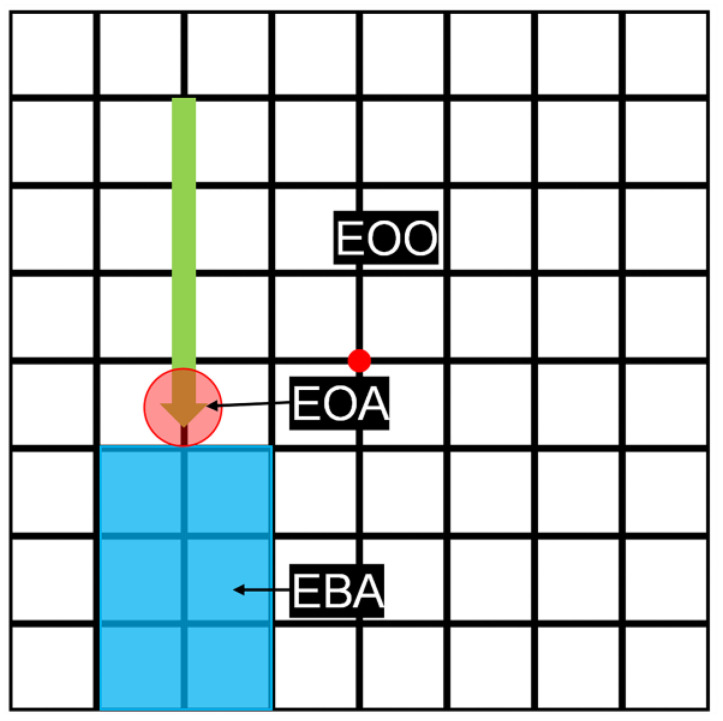
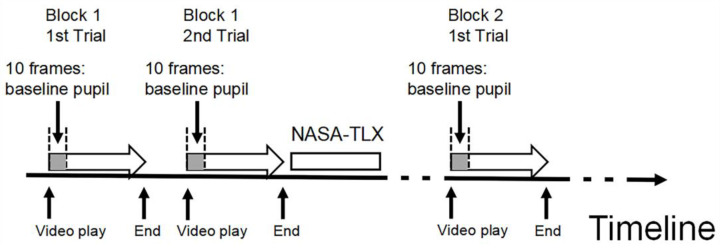
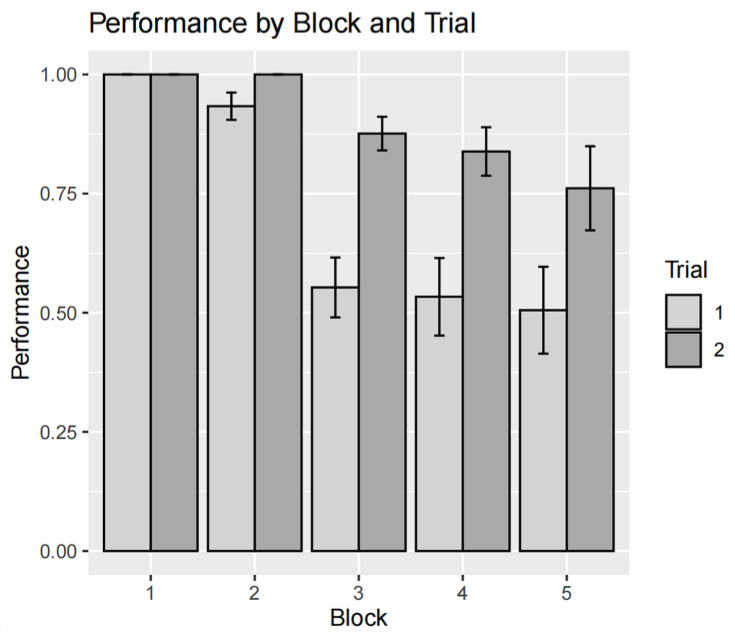
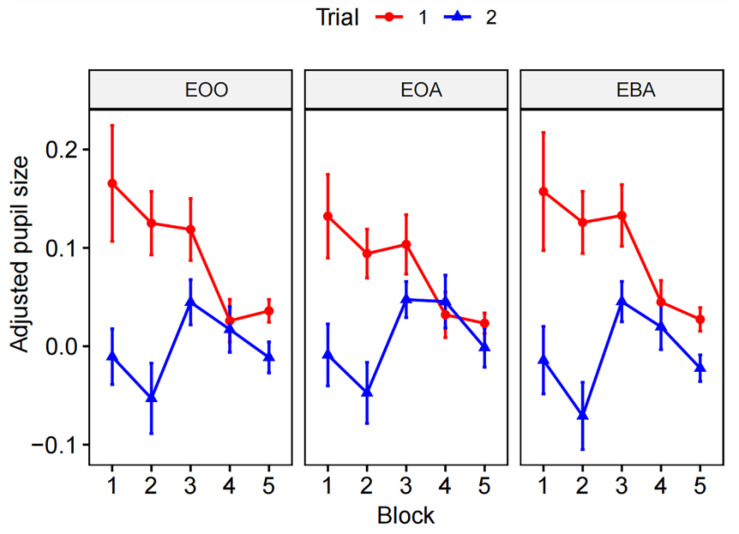
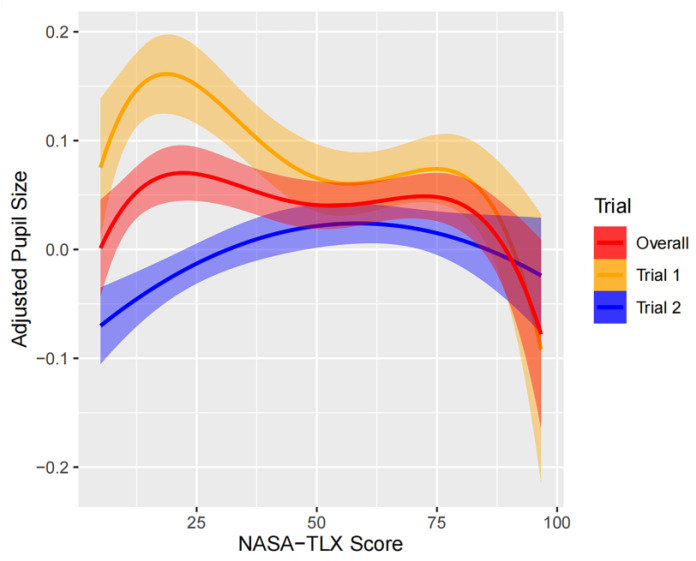
Pupil size is a significant biosignal for human behavior monitoring and can reveal much underlying information. This study explored the effects of task load, task familiarity, and gaze position on pupil response during learning a visual tracking task. We hypothesized that pupil size would increase with task load, up to a certain level before decreasing, decrease with task familiarity, and increase more when focusing on areas preceding the target than other areas. Fifteen participants were recruited for an arrow tracking learning task with incremental task load. Pupil size data were collected using a Tobii Pro Nano eye tracker. A 2 × 3 × 5 three-way factorial repeated measures ANOVA was conducted using R (version 4.2.1) to evaluate the main and interactive effects of key variables on adjusted pupil size. The association between individuals' cognitive load, assessed by NASA-TLX, and pupil size was further analyzed using a linear mixed-effect model. We found that task repetition resulted in a reduction in pupil size; however, this effect was found to diminish as the task load increased. The main effect of task load approached statistical significance, but different trends were observed in trial 1 and trial 2. No significant difference in pupil size was detected among the three gaze positions. The relationship between pupil size and cognitive load overall followed an inverted U curve. Our study showed how pupil size changes as a function of task load, task familiarity, and gaze scanning. This finding provides sensory evidence that could improve educational outcomes.
Keywords: biosignal; gaze position; pupil responses; task familiarity; task load; visual tracking.
Conflict of interest statement
The authors declare no conflicts of interest.
Figures
Similar articles
-
Eye tracker calibration: How well can humans refixate a target?Behav Res Methods. 2024 Dec 19;57(1):23. doi: 10.3758/s13428-024-02564-4. Behav Res Methods. 2024. PMID: 39702537 Free PMC article.
-
Pupil size dynamics during fixation impact the accuracy and precision of video-based gaze estimation.Vision Res. 2016 Jan;118:48-59. doi: 10.1016/j.visres.2014.12.018. Epub 2015 Jan 9. Vision Res. 2016. PMID: 25578924
-
Cognitive load in tele-robotic surgery: a comparison of eye tracker designs.Int J Comput Assist Radiol Surg. 2024 Jul;19(7):1281-1284. doi: 10.1007/s11548-024-03150-x. Epub 2024 May 5. Int J Comput Assist Radiol Surg. 2024. PMID: 38704792
-
Using mobile eye tracking to measure cognitive load through gaze behavior during walking in lower limb prosthesis users: A preliminary assessment.Clin Biomech (Bristol). 2024 May;115:106250. doi: 10.1016/j.clinbiomech.2024.106250. Epub 2024 Apr 12. Clin Biomech (Bristol). 2024. PMID: 38657356
-
Beyond eye gaze: What else can eyetracking reveal about cognition and cognitive development?Dev Cogn Neurosci. 2017 Jun;25:69-91. doi: 10.1016/j.dcn.2016.11.001. Epub 2016 Nov 11. Dev Cogn Neurosci. 2017. PMID: 27908561 Free PMC article. Review.
Cited by
-
Early Eye Disengagement Is Regulated by Task Complexity and Task Repetition in Visual Tracking Task.Sensors (Basel). 2024 May 8;24(10):2984. doi: 10.3390/s24102984. Sensors (Basel). 2024. PMID: 38793839 Free PMC article.
References
-
- Beatty J., Kahneman D. Pupillary Changes in Two Memory Tasks. Psychon. Sci. 1966;5:371–372. doi: 10.3758/BF03328444. - DOI
MeSH terms
Grants and funding
LinkOut - more resources
Full Text Sources
