. 2024 May 28;43(5):114112.
doi: 10.1016/j.celrep.2024.114112. Epub 2024 Apr 26.

Focal clusters of peri-synaptic matrix contribute to activity-dependent plasticity and memory in mice

Affiliations

Focal clusters of peri-synaptic matrix contribute to activity-dependent plasticity and memory in mice

Gabriele Chelini et al. Cell Rep. .

Abstract

Recent findings show that effective integration of novel information in the brain requires coordinated processes of homo- and heterosynaptic plasticity. In this work, we hypothesize that activity-dependent remodeling of the peri-synaptic extracellular matrix (ECM) contributes to these processes. We show that clusters of the peri-synaptic ECM, recognized by CS56 antibody, emerge in response to sensory stimuli, showing temporal and spatial coincidence with dendritic spine plasticity. Using CS56 co-immunoprecipitation of synaptosomal proteins, we identify several molecules involved in Ca2+ signaling, vesicle cycling, and AMPA-receptor exocytosis, thus suggesting a role in long-term potentiation (LTP). Finally, we show that, in the CA1 hippocampal region, the attenuation of CS56 glycoepitopes, through the depletion of versican as one of its main carriers, impairs LTP and object location memory in mice. These findings show that activity-dependent remodeling of the peri-synaptic ECM regulates the induction and consolidation of LTP, contributing to hippocampal-dependent memory.

Keywords: CP: Cell biology; CP: Neuroscience; CS clusters; chondrotin sulfate proteoglycans; extracellular matrix; hippocampus; immunoprecipitation; learning and memory; sensory manipulation; synaptic plasticity; versican.


Conflict of interest statement

Declaration of interests The authors declare no competing interests.

Figures

Figure 1.
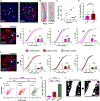
Figure 1.. CS56 forms peri-synaptic coating within and outside of CSCs
(A) Thy-1-positive apical dendrites intersect several CSCs within multiple layers of the mouse barrel cortex. Scale bar, 150 μm. (B) CS56 punctate labeling is juxtaposed to Thy-1-positive dendritic spines (arrowheads). Scale bar, 2 μm. (C) Representative photomicrograph showing sparse juxtaposition (arrowheads) of PSD95-IR and CS56-IR puncta outside CSCs. Scale bar, 2 μm. (D) The percentage of PSD95-IR puncta juxtaposed to CS56-IR puncta is higher within D-CSCs with respect to adjacent areas. n = 5 D-CSCs and 5 control images from three mice. D-CSC mean = 5.82, SEM = 0.59, t test; control mean = 3.22, SEM = 0.59; p = 0.0004, 95% confidence interval (CI) −4.025 to −1.357. (E) Examples of CS56 immunoreactivity (red arrow) associated with synapses: (E1) dendritic spine (in purple), (E2) axodendritic synapses, and (E3) axosomatic synapses. Pre-synaptic elements are highlighted in green. Post-synaptic elements are highlighted in yellow. Scale bar, 500 nm. (F and G) CS56 ultrastructural location within R-CSCs and D-CSCs. Left: representative confocal photomicrograph of one R-CSC (F) and one D-CSC (G) (asterisks mark glial processes; scale bar, 25 μm). Center: CS-IR products within glial cell processes (red arrows) for both R-CSC (F) and D-CSC (G). Scale bar, 500 nm. Right: the difference between CS56-immunonegative (empty blue arrows) and immunopositive (blue-filled arrows) synapses within R-CSCs (F) and D-CSCs (G). Scale bar, 500 nm. Glial processes are circumscribed in red, endfeet in blue. (H–J) Pie charts depicting the absolute number of CS56-IR elements within one prototypical R-CSC and one D-CSC. (H) R-CSCs present with predominant CS56 immunoreactivity within glial processes. (I) In contrast, D-CSCs present with higher numbers of CS56-IR synaptic coatings. (J) Similar amounts of CS56 immunoreactivity in glial endfeet are observed in R-CSCs and D-CSCs. Error bars indicate SEM. ***p < 0.0001.
Figure 2.
Figure 2.. In the barrel cortex of naive home-caged mice, CSCs present molecular and subcellular features associated with activity-dependent plasticity
(A) Confocal photomicrographs showing multiple ARC-IR dendrites (white arrowhead) within D-CSCs in the mouse BCx. Scale bar, 25 μm. (B) Virtual maps depicting the distribution of CSCs (red stars) and ARC-positive dendrites (blue lines) in two representative subjects. The left image shows the concomitant high density of both CSCs and ARC+ dendrites; the right image shows low density of both elements. Scale bar, 150 μm. (C) The number of CSCs positively correlates with ARC-IR dendrites within the BCx. n = 8 slices from four mice. r = 0.76, p = 0.02, CI 0.1312 to 0.9549. (D) D-CSCs contain higher numbers of ARC+ dendrites compared to R-CSCs. R-CSCs n = 17, mean = 1.88, SEM = 0.37; D-CSCs n = 31, mean = 3.35, SEM = 0.24; from four animals; t test p = 0.003; CI 0.4631 to 2.247. (E) Within R-CSCs, dendritic spines present wider and shorter heads, but unaltered necks compared to outside CSCs. n = 194 spines within R-CSCs, n = 154 control spines over four dendrites from four different animals. Mann-Whitney: neck length, R-CSCs mean = 0.44, SEM = 0.01; control mean = 0.45, SEM = 0.01; p = 0.347, CI −0.02 to 0.06. Head length, R-CSCs mean = 0.56, SEM = 0.01; control mean = 0.61, SEM = 0.01; p = 0.004, CI 0.02 to 0.1. Head width, R-CSCs mean = 0.56, SEM = 0.01; control mean = 0.45, SEM = 0.01; p < 0.0001, CI −0.17 to −0.07. The photomicrograph on the left shows an example of an R-CSC containing layer 2/3 apical dendrites. Scale bar, 25 μm. (F) Within D-CSCs, dendritic spines are smaller compared to spines located outside CSCs. n = 216 spines within D-CSCs, n = 206 control spines over six dendrites from four different animals. Mann-Whitney: neck length, D-CSCs mean = 0.44, SEM = 0.01; control mean = 0.51, SEM = 0.01; p = 0.012, CI 0.01 to 0.1. Head length, D-CSCs mean = 0.63, SEM = 0.01; control mean = 0.66, SEM = 0.01; p = 0.047, CI 0 to 0.09. Head width, D-CSCs mean = 0.57, SEM = 0.01; control mean = 0.61, SEM = 0.01; p = 0.024, CI 0 to 0.08. The photomicrograph on the left shows an example of a D-CSC containing layer 2/3 apical dendrites. Scale bar, 25 μm. White arrowheads identify the dendrites that were used for dendritic spine analysis for the given images. (G) The correlation between spine head length and width is stronger within CSCs. Length-width correlation: R-CSCs r = 0.689, p < 0.0001, CI 0.6075 to 0.7567; D-CSCs r = 0.621, p < 0.0001, CI 0.5325 to 0.6974; control r = 0.509, p < 0.0001, CI 0.4288 to 0.5827. Z test: R-CSCs vs. D-CSCs p = 0.23; R-CSCs vs. control p = 0.001; D-CSCs vs. control p = 0.04. (H) Spines within R-CSCs are stubbier than outside CSCs, while spines within D-CSCs present with intermediate geometrical relationships: length/width ratio, R-CSCs mean = 1.029, SEM = 0.01; D-CSCs mean = 1.149, SEM = 0.02; controls mean = 1.39, SEM = 0.04. t test: R-CSCs vs. D-CSCs p < 0.0001, CI 0.05757 to 0.1837. R-CSCs vs. control p < 0.0001, CI 0.2371 to 0.4868. D-CSCs vs. control p < 0.0001, CI 0.1205 to 0.3621. (I) Confocal photomicrographs showing spines with large heads and short necks within R-CSCs (magenta arrows)—outside CSC spines have narrower heads and longer necks (gray arrows). Scale bar, 2 μm. Error bars indicate SEM. *p < 0.05, **p < 0.001, ***p < 0.0001.
Figure 3.
Figure 3.. Sensory experience affects numerical densities of CSCs in the BCx
(A) Experimental design for sensory deprivation experiment. (B) Representative photomicrographs depicting reduced CSC numerical densities (NDs) in the BCx of a sensory-deprived hemisphere (right) compared to a non-deprived hemisphere (left). Red contouring highlights the BCx. Scale bar, 500 μm. (C) Sensory deprivation shifts CSC NDs in favor of the non-deprived hemisphere in deprived mice, while controls show a comparable number of CSCs across hemispheres. Deprived n = 5; controls n = 6; Z test contralateral bias index (CBI): controls mean = 0.49, SEM = 0.04; p = 0.86, CI −0.1130 to 0.09871. Deprived mean = 0.4, SEM = 0.02; p = 0.0001, CI −0.1545 to −0.02621. (D) This result is mostly driven by significant changes affecting predominantly layers 2/3 and 5. Z test CBI layer 2/3: deprived mean = 0.39, SEM = 0.01; p < −0.0001, CI −0.1692 to 0.06925. CBI layer 5: deprived mean = 0.45, SEM = 0.02; p = 0.013, CI −0.1273 to −0.007380. (E) Both R-CSCs and D-CSCs decrease following whisker deprivation. Z test CBI R-CSCs: controls mean = 0.51, SEM = 0.0471; p = 0.81, CI −0.1102 to 0.1323, n = 5; deprived mean = 0.43, SEM = 0.0471; p < 0.0001, CI −0.1067 to −0.01829, n = 5. Z test CBI D-CSCs: controls mean = 0.53, SEM = 0.0938; p = 0.72, CI −0.2292 to 0.2922, n = 5; deprived mean = 0.44, SEM = 0.0272; p = 0.03, CI −0.1438 to 0.02960, n = 4. (F) Experimental design for sensory stimulation. (G and H) R-CSCs increase 1 h post-stimulation in layer 5 of the BCx. n = 6 stimulated, n = 6 controls. Z test CBI R-CSCs mean = 0.61, SEM = 0.03; p = 0.017, CI 0.003703 to 0.2200. D-CSCs mean = 0.48, SEM = 0.02; p = 0.496, CI −0.04495 to 0.07607. Conversely, D-CSCs selectively increase at 2 h post-stimulation. n = 6 stimulated, n = 6 controls. Z test CBI: R-CSCs mean = 0.48, SEM = 0.05; p = 0.727, CI −0.1503 to 0.1148; D-CSCs mean = 0.58, SEM = 0.01; p < 0.003, CI 0.006922 to 0.1168. Error bars indicate SEM. *p < 0.05, **p < 0.001, ***p < 0.0001.
Figure 4.
Figure 4.. LC-MS/MS proteomic analysis of P2, containing crude synaptosomal fractions, suggests that CS56 may play a pivotal role in LTP
(A) Diagram describing the workflow for the preparation of samples to be analyzed with proteomics. B) Western blot of pre-IP protein lysates from the mouse primary somatosensory cortex showing a CS56-positive band at approximately 80 kDa molecular weight, in both S2 (containing the light membrane, left side) and P2 (containing crude synaptosomal fractions, right side). (C) A representative picture of a gel colored with silver staining after CS56 IP confirms the specificity of the 80 kDa band. This band was excised from the gel and used for proteomics. (D) Comparison between the log-normalized abundance of CSPG core proteins revealed a preferential association of Vcan and brevican with CS56. Vcan mean = 16.27, SEM = 0.19; brevican mean = 16.47, SEM = 0.17; aggrecan mean = 15.12, SEM = 0.18; neurocan mean = 14.04; SEM = 0.19. One-way ANOVA with Bonferroni correction for multiple comparisons, n = 4 pools of 4 mice per pool (16 total), two replicates per pool: Vcan vs. brevican p > 0.999, CI −0.5644 to 0.1591; Vcan vs. aggrecan p = 0.005, CI 0.7012 to 1.605; Vcan vs. neurocan p < 0.0001, CI 0.9390 to 3.527; brevican vs. aggrecan p = 0.001, CI 0.8954 to 1.816; brevican vs. neurocan p < 0.0001, CI 1.503 to 3.369; aggrecan vs. neurocan p = 0.009, CI −0.1207 to 2.281. (E) Both Vcan and brevican, as well as neurocan, were found after CS56 IP in the human postmortem amygdala (the values shown represent two technical replicates on a single subject). (F) Heatmap depicting the normalized abundance of synaptic plasticity-related proteins identified after CS56 IP from P2. The highest expression was found for synapsins and synaptotagmin-1. Note also the presence of ADA proteins, confirming CS56 as an ideal substrate for promoting activity-dependent remodeling of peri-synaptic ECM. (SYN, synapsins; SYT, synaptotagmins; SYG, synaptogyrins; SVT2, synaptic vesicle glycoproteins-2; SYPH, synaptophysin; ADA, disintegrin and metalloproteinase domain-containing proteins. Error bars indicate SEM. **p < 0.001, ***p < 0.0001. SOM1, primary somatosensory cortex; S1, supernatant 1; S2, supernatant 2; P1, pellet 1; P2, pellet 2.
Figure 5.
Figure 5.. The expression of 6-sulfated chondroitin sulfate depends on the expression of the proteoglycan versican
(A) Representative photomicrograph showing CS56C co-localization with versican (Vcan) in both the BCx (top) and the CA1 hippocampal field (bottom). Scale bar, 25 μm. (B) Representative scatterplot showing partial co-localization of Vcan and CS56 in BCx and CA1 in one representative photomicrograph. Mander’s average co-localization coefficients: Vcan-CS56, BCx 0.491, CA1 0.497. CS56-Vcan, BCx 0.46, CA1 0.492. n = 3 mice. (C) Diagram showing the site targeted by Vcan shRNA to downregulate Vcan expression. (D) Vcan shRNA successfully knocks down Vcan in dissociated cultures. t test: control mean = 1, SEM = 0.1, n = 8; Vcan-shRNA mean = 0.47, SEM = 0.04, n = 12; p < 0.0001, CI −0.6254 to −0.2257. (E and F) Vcan downregulation is paralleled by reduced expression of Chst7 6-O-sulfotransferase (E) and does not affect the expression of 4-O-sulfotransferases (Chst11 and 12) (F). t test: Vcan shRNA n = 4, controls n = 4. Chst3: control mean = 1, SEM = 0.1; Vcan shRNA mean = 0.96, SEM = 0.04; p = 0.75, CI −0.3132 to 0.2394. Chst7: control mean = 1, SEM = 0.08; Vcan shRNA mean = 0.54, SEM = 0.009; p = 0.001, CI −0.6517 to −0.2497. Chst11: control mean = 1, SEM = 0.08; Vcan shRNA mean = 1.01, SEM = 0.11; p = 0.9, CI −0.3302 to 0.3647. Chst12: control mean = 1, SEM = 0.04; Vcan shRNA mean = 0.97, SEM = 0.06; p = 0.78, CI −0.2107 to 0.1671. (G and H) Vcan shRNA infusion downregulates CS56 expression in CA1 (G) but does not affect CS4 (H). Left: representative photomicrographs from the CA1 hippocampal region of one subject treated with control shRNA (top) or one treated with Vcan shRNA (bottom). Scale bar, 25 μm. Right: comparison of the mean fluorescence intensity for both CS56 (G) and CS4 (H). t test: controls n = 6, Vcan shRNA n = 7. CS56: control mean = 1.01, SEM = 0.13; Vcan shRNA mean = 0.72, SEM = 0.03; p = 0.04, CI −0.5738 to −0.01562. CS4: control mean = 1, SEM = 0.14; Vcan shRNA mean = 0.75, SEM = 0.08; p = 0.15, CI −0.5976 to 0.1113. Error bars indicate SEM. *p < 0.05, **p < 0.001.
Figure 6.
Figure 6.. Vcan downregulation impairs hippocampal-dependent memory and CA1 LTP
(A) Schematic view of the experimental timeline. Scale bar, 500 μm. (B) Graphical representation of the behavioral test experimental design. (C–E) n = 7 for control mice (white and shaded white bars) and n = 9 for Vcan shRNA mice (gray and shaded bars). OL, old location; NL, new location; OO, old object; NO, new object. (C) During the recall session, both groups of mice treated with control or Vcan shRNA showed a preference for the novel location; paired t test: control, OL mean = 17.16, SEM = 2.22; NL mean = 37.2, SEM = 6.16; p = 0.006, CI 8.116 to 31.97; Vcan shRNA, OL mean = 20.78, SEM = 2.64; NL mean = 28.17, SEM = 3.03; p = 0.001, CI 4.010 to 10.77, but the preference index significantly decreased after Vcan knockdown. Preference index: Mann-Whitney test, control mean = 35.3, SEM = 4.4; Vcan shRNA mean = 15.78, SEM = 2.78; p = 0.001, CI −30.86 to −7.887. (D) New object preference in the NORT was unaffected in Vcan-shRNA-treated mice compared to controls; paired t test: control, OO mean = 21.17, SEM = 2.22; NO mean = 62.47, SEM = 5.75; p < 0.001, CI 26.03 to 56.57; Vcan shRNA, OO mean = 16.73, SEM = 1.78; NO mean = 52, SEM = 6.11; p < 0.001, CI 19.49 to 51.05. Preference index: Mann-Whitney test, control mean = 49.23, SEM = 5.63; Vcan shRNA mean = 49.03, SEM = 6.57; p > 0.99, CI −16.40 to 19.73. (E) Vcan knockdown does not affect the basic locomotor activity or generalized anxiety in the open field; t test: time center, controls mean = 143.7, SEM = 16.51; Vcan shRNA mean = 43.3, SEM = 11.97; p = 0.098, CI −43.01 to 42.20. t test: time borders, controls mean = 459.2, SEM = 15.87; Vcan shRNA mean = 459.1, SEM = 11.93; p = 0.099, CI −41.78 to 41.59. (F) Diagram showing the location of stimulation and recording sites in the hippocampus used in the ex vivo experiments. (G) The input/output curve shows no difference in the fEPSPs of mice treated with Vcan shRNA compared to the control; repeated-measures two-way ANOVA p = 0.8369, CI −0.1097 to 0.1340. (H) Paired-pulse facilitation is unaffected by Vcan shRNA treatment; t test: control mean = 2.37, SEM = 0.13, n = 5 slices from three animals; Vcan shRNA mean = 2.33, SEM = 0.06, n = 5 slices from three animals, p = 0.8083, CI −0.3873 to 0.3113. (I) A scheme showing the time windows used for measurements of the fast (predominantly AMPA receptor mediated) and slow (predominantly NMDA receptor mediated) components of theta-burst-induced fEPSPs. (J) Reduction in potentiation of the fast and no changes in the slow component after Vcan knockdown. Mann-Whitney test: fast, control mean = 1.91, SEM = 0.06; Vcan shRNA mean = 1.76, SEM = 0.04; p = 0.049, CI −0.2957 to −0.001388. Slow: control mean = 0.29, SEM = 0.01; Vcan shRNA mean = 0.29, SEM = 0.02; p > 0.99, CI −0.05976 to 0.06310. (K) TBS-induced synaptic potentiation is impaired by Vcan shRNA treatment in all 10 min intervals after TBS; repeated-measures two-way ANOVA, Fisher’s LSD post hoc analysis, p = 0.0196, CI 0.02769 to 0.2816. (L) Representative traces showing changes in the fEPSP slope before (dashed line) and after (solid line) TBS, for control (top) and Vcan-shRNA-treated (bottom) mice. (M) LTP is significantly impaired by Vcan shRNA treatment 50–60 min after TBS; t test: control mean = 1.37, SEM = 0.04, n = 12 slices from five mice; Vcan shRNA mean = 1.19, SEM = 0.04, n = 9 slices from six mice, p = 0.0086, CI 0.3155 to 0.05246. Error bars indicate SEM. *p < 0.05, **p < 0.001, ***p < 0.0001.
Figure 7.
Figure 7.. Model of CSC dynamics associated with localized synaptic plasticity
We propose that CSCs are transient structures involved in regulating multi-synaptic, activity-dependent plasticity within a segregated space. Our evidence suggests that R-CSCs emerge during the rising phase of s-LTP, characterized by significantly increased synaptic size and accumulation of converging CS56-IR glial processes. D-CSCs, in contrast, show a decrease in synaptic size as well as spatiotemporal association with ARC protein, suggesting that they might correspond to the inversion phase of local structural plasticity and the beginning of the s-LTD.

Similar articles

Cited by

References

    1. Kastellakis G, and Poirazi P (2019). Synaptic clustering and memory formation. Front. Mol. Neurosci. 12, 300. 10.3389/fnmol.2019.00300. - DOI - PMC - PubMed
    1. Caroni P, Donato F, and Muller D (2012). Structural plasticity upon learning: regulation and functions. Nat. Rev. Neurosci. 13, 478–490. 10.1038/nrn3258. - DOI - PubMed
    1. Govindarajan A, Israely I, Huang S-Y, and Tonegawa S (2011). The dendritic branch is the preferred integrative unit for protein synthesis-dependent LTP. Neuron 69, 132–146. 10.1016/j.neuron.2010.12.008. - DOI - PMC - PubMed
    1. El-Boustani S, Ip JPK, Breton-Provencher V, Knott GW, Okuno H, Bito H, and Sur M (2018). Locally coordinated synaptic plasticity of visual cortex neurons in vivo. Science 360, 1349–1354. 10.1126/science.aao0862. - DOI - PMC - PubMed
    1. Jenks KR, Tsimring K, Ip JPK, Zepeda JC, and Sur M (2021). heterosynaptic plasticity and the experience-dependent refinement of developing neuronal circuits. Front. Neural Circuits 15, 803401. 10.3389/fncir.2021.803401. - DOI - PMC - PubMed

Publication types