

Differences in educational opportunity predict white matter development
- PMID: 38676989
- PMCID: PMC11636918
- DOI: 10.1016/j.dcn.2024.101386
Differences in educational opportunity predict white matter development
Abstract
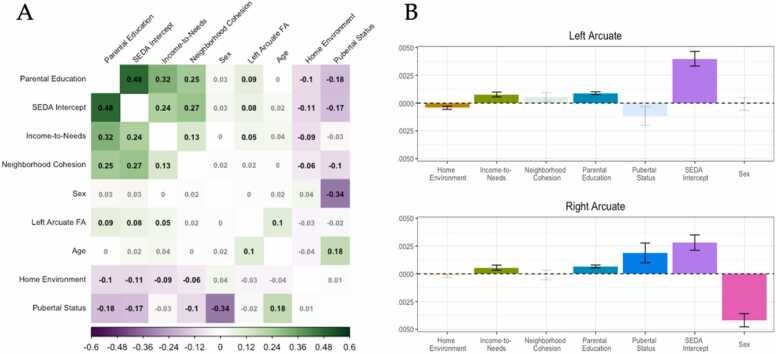
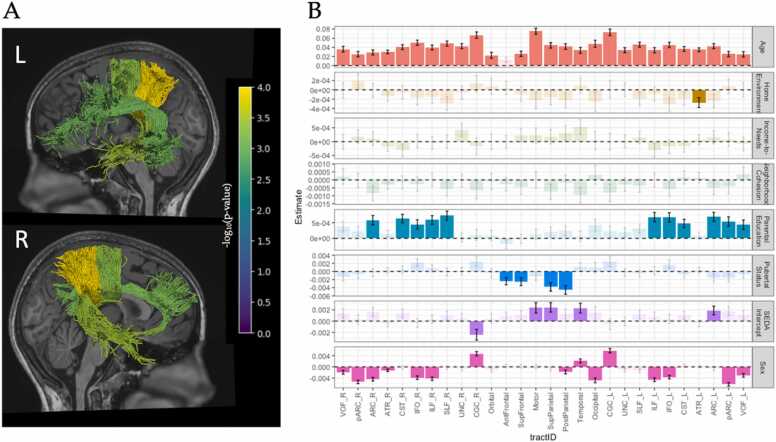
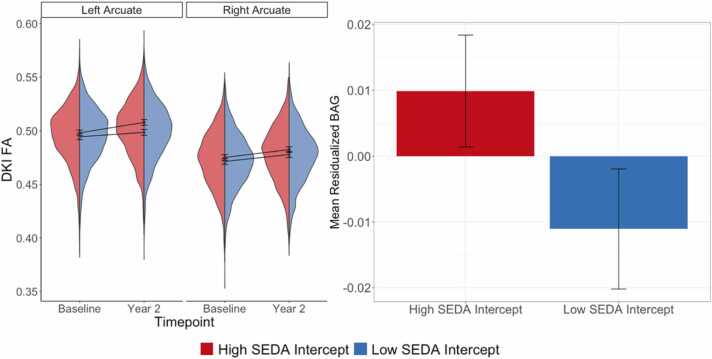
Coarse measures of socioeconomic status, such as parental income or parental education, have been linked to differences in white matter development. However, these measures do not provide insight into specific aspects of an individual's environment and how they relate to brain development. On the other hand, educational intervention studies have shown that changes in an individual's educational context can drive measurable changes in their white matter. These studies, however, rarely consider socioeconomic factors in their results. In the present study, we examined the unique relationship between educational opportunity and white matter development, when controlling other known socioeconomic factors. To explore this question, we leveraged the rich demographic and neuroimaging data available in the ABCD study, as well the unique data-crosswalk between ABCD and the Stanford Education Data Archive (SEDA). We find that educational opportunity is related to accelerated white matter development, even when accounting for other socioeconomic factors, and that this relationship is most pronounced in white matter tracts associated with academic skills. These results suggest that the school a child attends has a measurable relationship with brain development for years to come.
Keywords: Development; Education; Socioeconomic Status; White Matter.
Copyright © 2024 The Authors. Published by Elsevier Ltd.. All rights reserved.
Conflict of interest statement
Declaration of Competing Interest The authors declare that they have no known competing financial interests or personal relationships that could have appeared to influence the work reported in this paper.
Figures
Similar articles
-
Sexual Harassment and Prevention Training.2024 Mar 29. In: StatPearls [Internet]. Treasure Island (FL): StatPearls Publishing; 2025 Jan–. 2024 Mar 29. In: StatPearls [Internet]. Treasure Island (FL): StatPearls Publishing; 2025 Jan–. PMID: 36508513 Free Books & Documents.
-
The Lived Experience of Autistic Adults in Employment: A Systematic Search and Synthesis.Autism Adulthood. 2024 Dec 2;6(4):495-509. doi: 10.1089/aut.2022.0114. eCollection 2024 Dec. Autism Adulthood. 2024. PMID: 40018061 Review.
-
Short-Term Memory Impairment.2024 Jun 8. In: StatPearls [Internet]. Treasure Island (FL): StatPearls Publishing; 2025 Jan–. 2024 Jun 8. In: StatPearls [Internet]. Treasure Island (FL): StatPearls Publishing; 2025 Jan–. PMID: 31424720 Free Books & Documents.
-
Do Patients of Different Levels of Affluence Receive Different Care for Pediatric Osteosarcomas? One Institution's Experience.Clin Orthop Relat Res. 2025 Apr 1;483(4):748-758. doi: 10.1097/CORR.0000000000003299. Epub 2024 Oct 30. Clin Orthop Relat Res. 2025. PMID: 39485923
-
Education support services for improving school engagement and academic performance of children and adolescents with a chronic health condition.Cochrane Database Syst Rev. 2023 Feb 8;2(2):CD011538. doi: 10.1002/14651858.CD011538.pub2. Cochrane Database Syst Rev. 2023. PMID: 36752365 Free PMC article.
Cited by
-
How does SES influence the brain circuitry for literacy? Modeling the association between SES, oral language, white matter integrity, and reading.Dev Cogn Neurosci. 2025 Jun;73:101561. doi: 10.1016/j.dcn.2025.101561. Epub 2025 Apr 24. Dev Cogn Neurosci. 2025. PMID: 40319671 Free PMC article.
-
Social Determinants of Health, the developing brain, and risk and resilience for psychopathology.Neuropsychopharmacology. 2025 Jul 16:10.1038/s41386-025-02169-1. doi: 10.1038/s41386-025-02169-1. Online ahead of print. Neuropsychopharmacology. 2025. PMID: 40670623 Review.
-
Longitudinal trajectories of brain development from infancy to school age and their relationship with literacy development.Proc Natl Acad Sci U S A. 2025 Jun 17;122(24):e2414598122. doi: 10.1073/pnas.2414598122. Epub 2025 Jun 10. Proc Natl Acad Sci U S A. 2025. PMID: 40493188 Free PMC article.
-
Longitudinal trajectories of brain development from infancy to school age and their relationship to literacy development.bioRxiv [Preprint]. 2025 Apr 6:2024.06.29.601366. doi: 10.1101/2024.06.29.601366. bioRxiv. 2025. Update in: Proc Natl Acad Sci U S A. 2025 Jun 17;122(24):e2414598122. doi: 10.1073/pnas.2414598122. PMID: 39005343 Free PMC article. Updated. Preprint.
-
Development of the arcuate fasciculus is linked to learning gains in reading.Imaging Neurosci (Camb). 2025 Apr 17;3:imag_a_00542. doi: 10.1162/imag_a_00542. eCollection 2025. Imaging Neurosci (Camb). 2025. PMID: 40800967 Free PMC article.
References
-
- Baker E.L., et al. Problems with the use of student test scores to evaluate teachers. EPI Briefing Paper# 278. Econ. Policy Inst. 2010
-
- Baker D.P., Akiba M., LeTendre G.K., Wiseman A.W. Worldwide shadow education: outside-school learning, institutional quality of schooling, and cross-national mathematics achievement. Educ. Eval. Policy Anal. 2001;23:1–17.
-
- Bates D., Mächler M., Bolker B., Walker S. Fitting linear mixed-effects models using lme4. J. Stat. Softw. 2015;67:1–48.
Publication types
MeSH terms
Grants and funding
- U24 DA041147/DA/NIDA NIH HHS/United States
- U01 DA051039/DA/NIDA NIH HHS/United States
- U01 DA041120/DA/NIDA NIH HHS/United States
- RF1 MH121868/MH/NIMH NIH HHS/United States
- U01 DA051018/DA/NIDA NIH HHS/United States
- U01 DA041093/DA/NIDA NIH HHS/United States
- U24 DA041123/DA/NIDA NIH HHS/United States
- U01 DA051038/DA/NIDA NIH HHS/United States
- U01 DA051037/DA/NIDA NIH HHS/United States
- U01 DA051016/DA/NIDA NIH HHS/United States
- U01 DA041106/DA/NIDA NIH HHS/United States
- U01 DA041117/DA/NIDA NIH HHS/United States
- U01 DA041148/DA/NIDA NIH HHS/United States
- R01 HD095861/HD/NICHD NIH HHS/United States
- U01 DA041174/DA/NIDA NIH HHS/United States
- U01 DA041134/DA/NIDA NIH HHS/United States
- U01 DA041022/DA/NIDA NIH HHS/United States
- U01 DA041156/DA/NIDA NIH HHS/United States
- U01 DA050987/DA/NIDA NIH HHS/United States
- U01 DA041025/DA/NIDA NIH HHS/United States
- U01 DA050989/DA/NIDA NIH HHS/United States
- U01 DA041089/DA/NIDA NIH HHS/United States
- U01 DA050988/DA/NIDA NIH HHS/United States
- U01 DA041028/DA/NIDA NIH HHS/United States
- U01 DA041048/DA/NIDA NIH HHS/United States
