. 2024 May:103:105127.
doi: 10.1016/j.ebiom.2024.105127. Epub 2024 Apr 26.

Multi-tissue profiling of oxylipins reveal a conserved up-regulation of epoxide:diol ratio that associates with white adipose tissue inflammation and liver steatosis in obesity

Affiliations

Multi-tissue profiling of oxylipins reveal a conserved up-regulation of epoxide:diol ratio that associates with white adipose tissue inflammation and liver steatosis in obesity

Charlotte Hateley et al. EBioMedicine. 2024 May.

Abstract

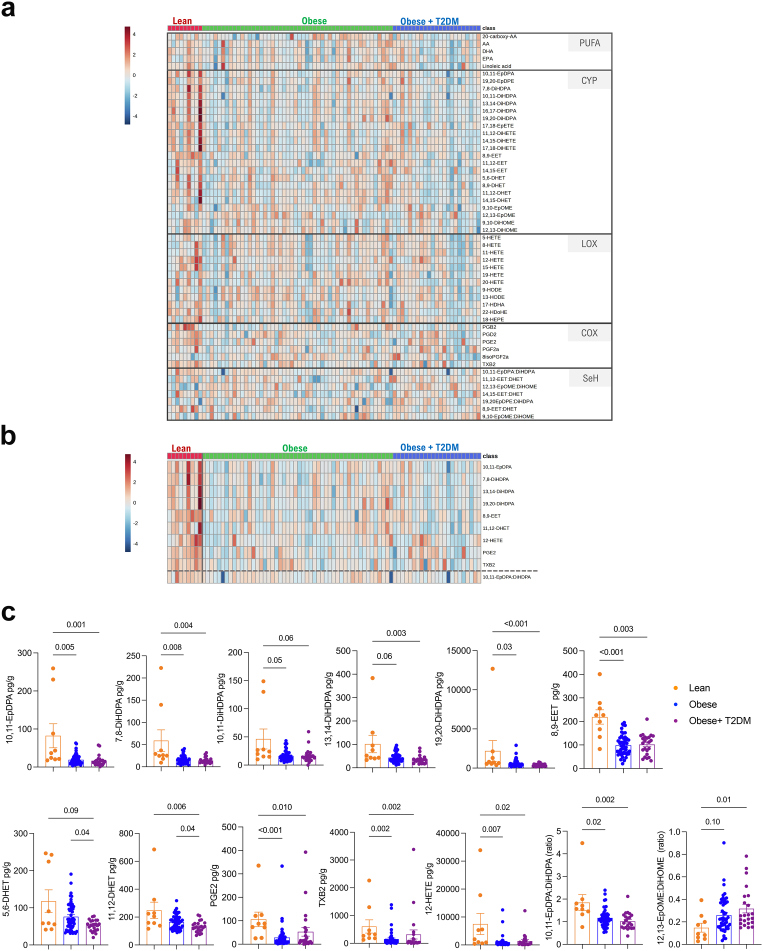
Background: Obesity drives maladaptive changes in the white adipose tissue (WAT) which can progressively cause insulin resistance, type 2 diabetes mellitus (T2DM) and metabolic dysfunction-associated liver disease (MASLD). Obesity-mediated loss of WAT homeostasis can trigger liver steatosis through dysregulated lipid pathways such as those related to polyunsaturated fatty acid (PUFA)-derived oxylipins. However, the exact relationship between oxylipins and metabolic syndrome remains elusive and cross-tissue dynamics of oxylipins are ill-defined.

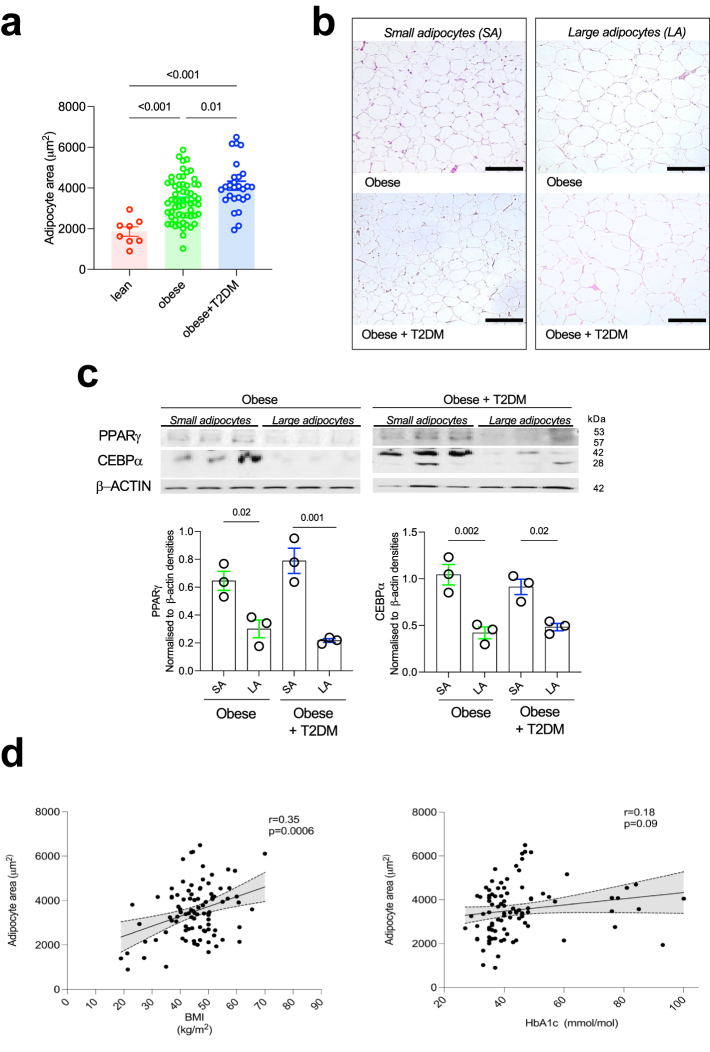
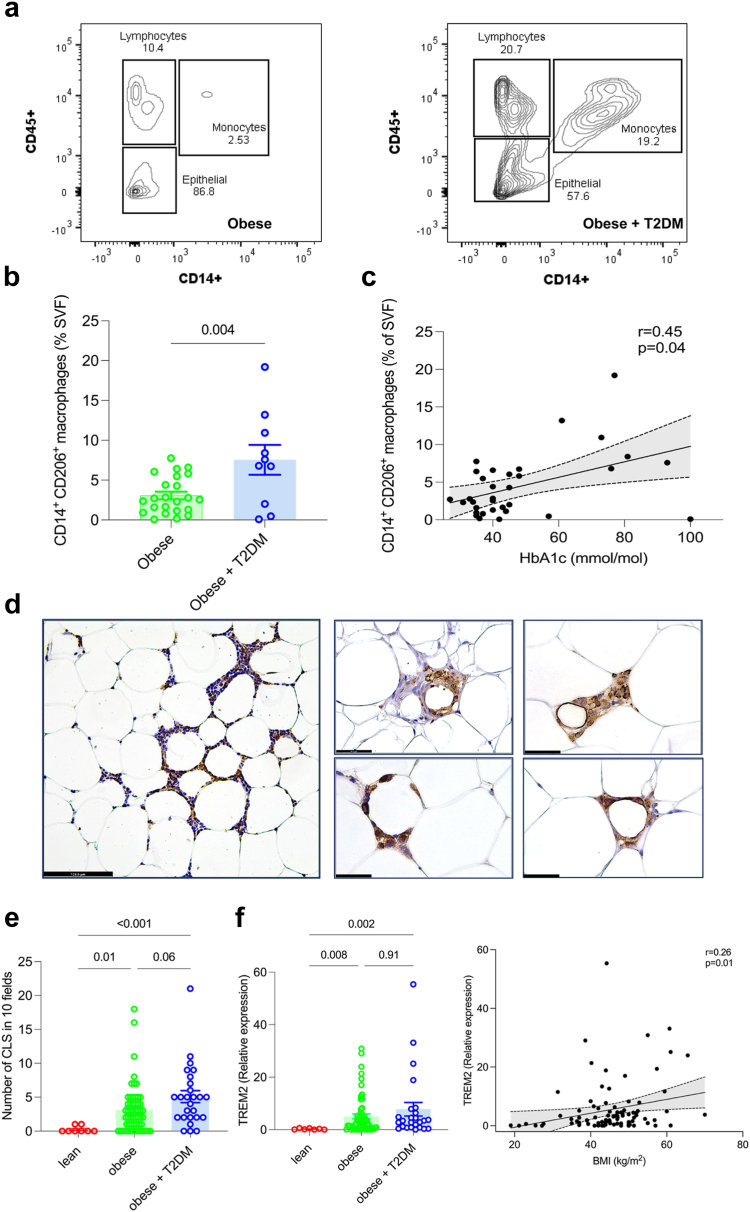
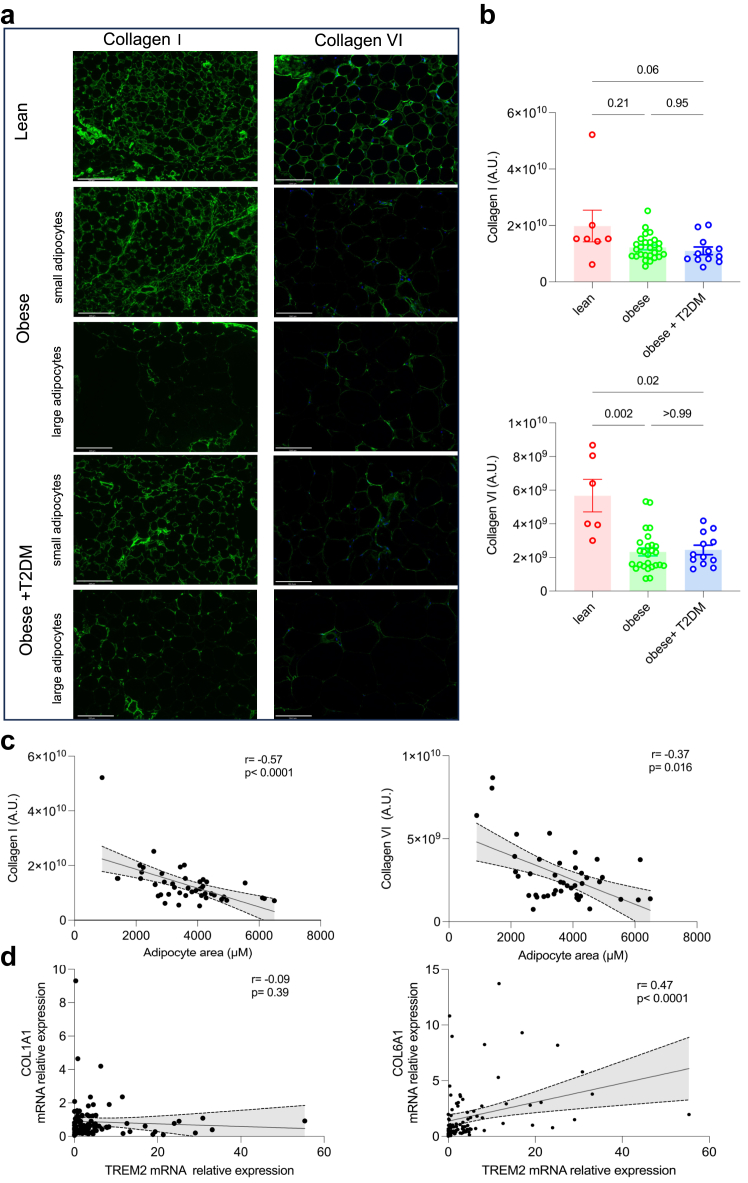
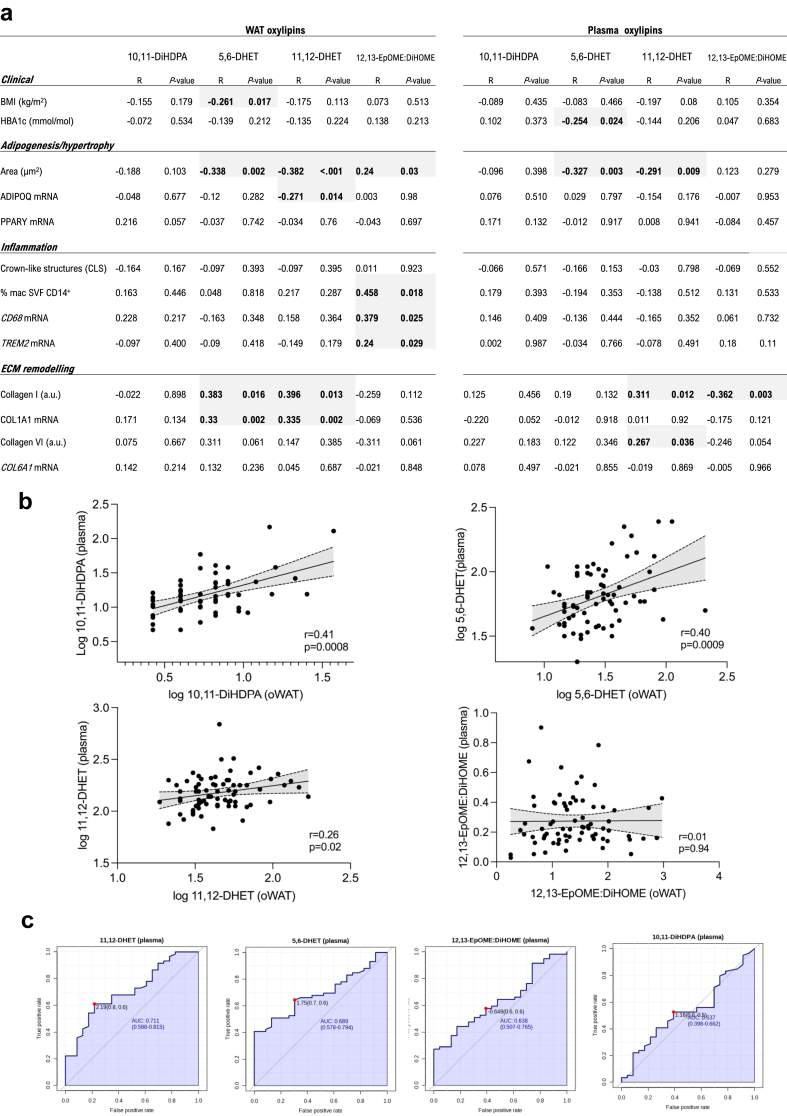
Methods: We quantified PUFA-related oxylipin species in the omental WAT, liver biopsies and plasma of 88 patients undergoing bariatric surgery (female N = 79) and 9 patients (female N = 4) undergoing upper gastrointestinal surgery, using UPLC-MS/MS. We integrated oxylipin abundance with WAT phenotypes (adipogenesis, adipocyte hypertrophy, macrophage infiltration, type I and VI collagen remodelling) and the severity of MASLD (steatosis, inflammation, fibrosis) quantified in each biopsy. The integrative analysis was subjected to (i) adjustment for known risk factors and, (ii) control for potential drug-effects through UPLC-MS/MS analysis of metformin-treated fat explants ex vivo.

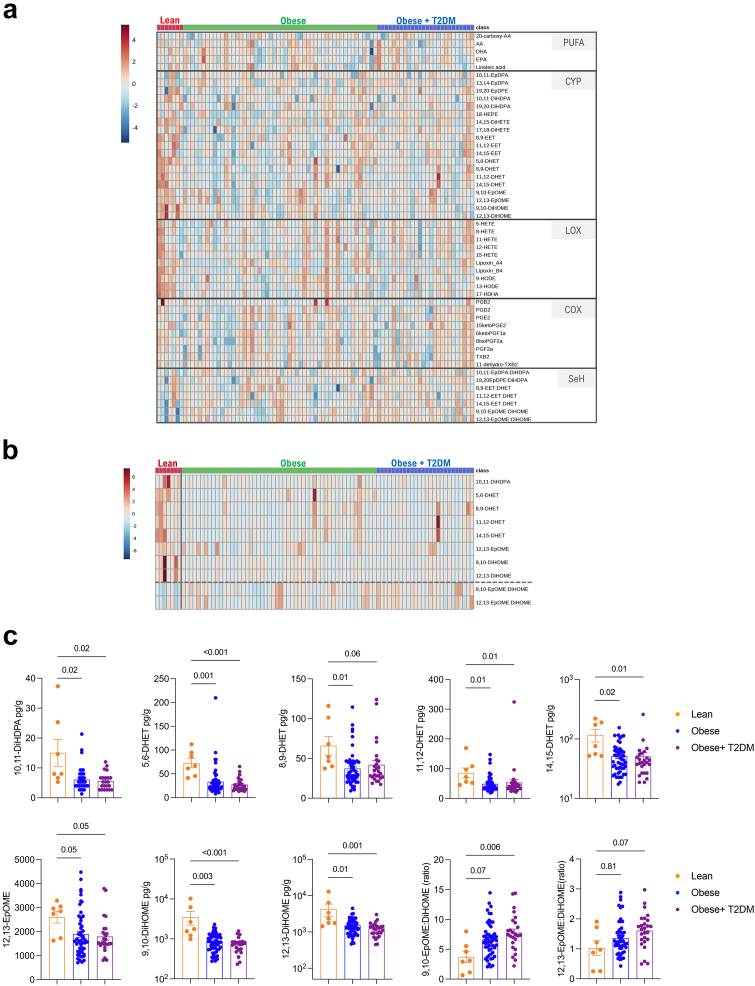
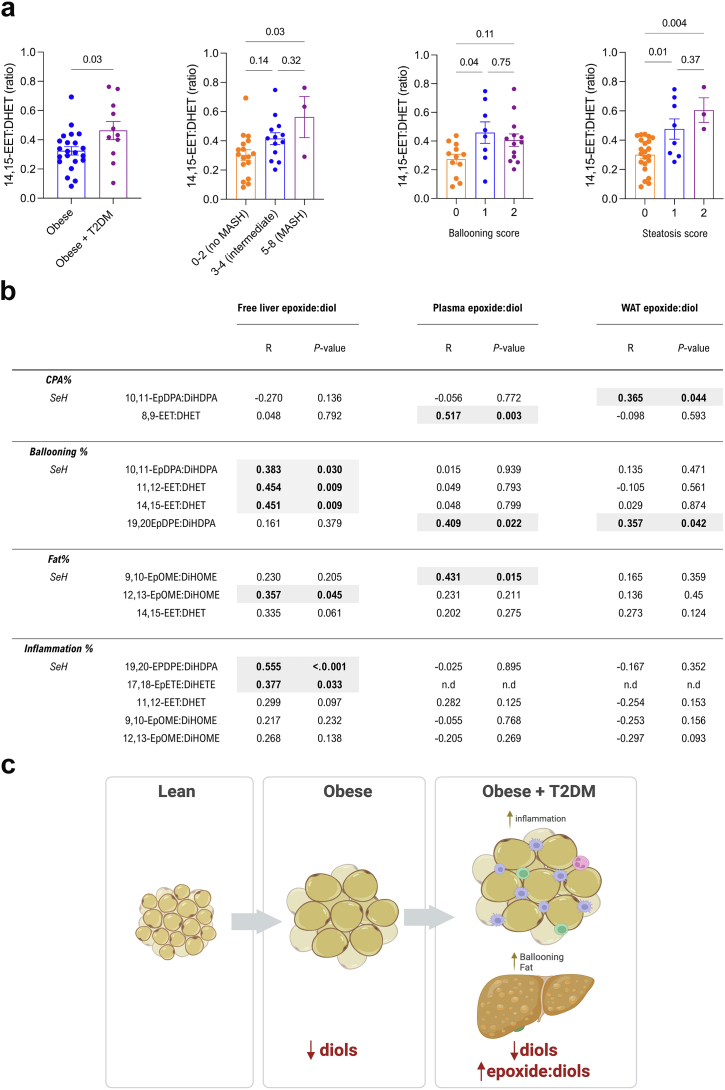
Findings: We reveal a generalized down-regulation of cytochrome P450 (CYP)-derived diols during obesity conserved between the WAT and plasma. Notably, epoxide:diol ratio, indicative of soluble epoxide hydrolyse (sEH) activity, increases with WAT inflammation/fibrosis, hepatic steatosis and T2DM. Increased 12,13-EpOME:DiHOME in WAT and liver is a marker of worsening metabolic syndrome in patients with obesity.

Interpretation: These findings suggest a dampened sEH activity and a possible role of fatty acid diols during metabolic syndrome in major metabolic organs such as WAT and liver. They also have implications in view of the clinical trials based on sEH inhibition for metabolic syndrome.

Funding: Wellcome Trust (PS3431_WMIH); Duke-NUS (Intramural Goh Cardiovascular Research Award (Duke-NUS-GCR/2022/0020); National Medical Research Council (OFLCG22may-0011); National Institute of Environmental Health Sciences (Z01 ES025034); NIHR Imperial Biomedical Research Centre.

Keywords: 12,13-EpOME:DiHOME; Diols; Epoxides; Metabolic syndrome; Obesity; Oxylipins.


Conflict of interest statement

Declaration of interests The authors declare no conflict of interest.

Figures

Fig. 1
Fig. 1
Adipocyte hypertrophy and hyperplasia in patients with obesity. (a) Average adipocyte area quantification in the WAT of lean patients (N = 9), patients with obesity (N = 61) and patients with obesity and T2DM (N = 27). (b) Representative H&E staining of omental WAT with presence of small adipocytes and large adipocytes in patients with obesity with and without T2DM. (c) Western Blot of WAT PPARγ and CEBP⍺ in patients with obesity with and without T2DM stratified according to the adipocyte size (N = 3 per group). (d) Correlation between adipocyte area (μm2) and BMI (kg/m2; left panel) and adipocyte area (μm2) and plasma glycated haemoglobin [HbA1c (mmol/mol); right panel]. Statistical significance was calculated using ANOVA with Tukey's multiple comparison test for (a) and (c) and using Pearson correlation coefficient for (d). Error bars represent SEM. Scale bars; 250 microns.
Fig. 2
Fig. 2
WAT inflammation during T2DM in patients with obesity. (a) Representative flow cytometry showing the increased proportion of monocytes/macrophages (CD45+, CD14+) in the SVF isolated from WAT of a patient with obesity and T2DM in comparison to a patient with obesity without T2DM. (b) Frequencies (%) of CD14+ CD206+ cells in the SVF of patients with obesity (N = 25) and patients with obesity and T2DM (N = 10). (c) Correlation between CD14+ CD206+cell frequencies and HbAc1 (mmol/mol) of patients with obesity (N = 33). (d) Representative IHC images for pan-macrophage marker CD68+ crown-like-structures (CLS) in the WAT of patients with obesity (N = 5 patients). (e) Quantification of CLS in the WAT of lean (N = 9), obese (N = 56) and patients with obesity and T2DM (N = 26). (f) TREM2 mRNA expression (left panel) in the WAT of lean patients (N = 7), obese (N = 60) and patients with obesity and T2DM (N = 25). Correlation (right panel) between CD68 and TREM2 mRNA expression in the WAT of lean patients (N = 7), patients with obesity (N = 60) and patients with obesity and T2DM (N = 25). Error bars represent mean ± SEM. Statistical significance was calculated using Pearson's Correlation (c) and Spearman's correlation coefficient (f, right panel), Kruskal–Wallis test with Dunn's multiple comparison (e) and (f) Student's two tailed T-test (b); scale bars; 124.5 microns.
Fig. 3
Fig. 3
WAT ECM remodelling during T2DM in patients with obesity. (a) Representative immunofluorescence images for type I and type VI Collagen in lean patients or patients with obesity, with or without T2DM, with presence of small adipocytes or large adipocytes. (b) Type I collagen fluorescence (top panel) raw intensities (A.U.) in lean (N = 7), patients with obesity (N = 27) and patients with obesity and T2DM (N = 12). Type VI collagen fluorescence (bottom panel) raw intensities (A.U.) in lean (N = 7), obese (N = 27) and patients with obesity and T2DM (N = 12). (c) Correlation between type I Collagen fluorescence intensities (A.U.) and adipocyte area (μm2) (N = 46, left panel). Correlation between type VI Collagen fluorescence raw intensities (A.U.) and adipocyte area (μm2) (N = 46, right panel). (d) Correlation between COL1A1 and TREM2 mRNA levels (N = 91, left panel). Correlation between COL6A1 and TREM2 mRNA levels (N = 91, right panel). Statistical significance was calculated using Spearman's correlation coefficient (c) and (d) and Kruskal–Wallis test followed by Dunn's multiple comparison (b); error bars are mean ± SEM, scale bar 124.5 microns.
Fig. 4
Fig. 4
WAT oxylipin quantification. (a) Heatmap showing PUFAs, CYP-, LOX-, COX-derived oxylipins, and sEH activity readout in lean patients (N = 7), patients with obesity (N = 52) and patients with obesity and T2DM (N = 26). (b) 10 most significantly changing oxylipins (FDR <0.2). and sEH activity ratios (separated by a dashed line) determined by Kruskal–Wallis test (see also Table S3). (c) CYP-derived epoxides and diols in lean pateints (N = 7), patients with obesity (N = 52) and patients with obesity and T2DM (N = 26). Heatmaps (a and b) were generated on normalized data (log10 transformed) and clustered using Ward. Significance was tested by Kruskal–Wallis test followed by Dunn's multiple comparison (c).
Fig. 5
Fig. 5
Plasma oxylipin quantification. (a) Heatmap showing PUFAs, CYP-, LOX-, COX-derived oxylipins, and sEH activity readout in lean patients (N = 9), patients with obesity (N = 50) and patients with obesity and T2DM (N = 25). (b) 10 most significantly changing (FDR<0.05) and sEH activity ratios (separated by a dashed line) determined by Kruskal–Wallis test. (c) LOX- , CYP- and COX-derived oxylipins in lean patients (N = 9), patients with obesity (N = 50) and patients with obesity and T2DM (N = 25). Heatmaps (a and b) were generated on normalized data (log10 transformed) and clustered using Ward. Significance was tested by Kruskal–Wallis test followed by Dunn's multiple comparison (c).
Fig. 6
Fig. 6
Integration of WAT and plasma oxylipins with WAT phenotypes. (a) Correlation of WAT (N = 83; left) and plasma (N = 80; right) 10,11-DiHDPA, 5,6-DHET, 11,12-DHET and 12,13-EpOME:DiHOME with clinical (BMI, HbA1C) and WAT (adipogenesis/hypertrophy, inflammation, ECM remodelling) phenotypes. Grey highlights denote significant associations. (b) Correlation of the 3 CYP-derived epoxides (pg/g) and 12,13-EpOME:DiHOME ratio between plasma and WAT (N = 72). (c) AUC curves of plasma levels of 3 CYP-derived epoxides (pg/g) and 12,13-EpOME:DiHOME ratio for T2DM diagnostic accuracy (N = 82). Significance was tested by Spearman's correlation coefficient (a and b).
Fig. 7
Fig. 7
Increased hepatic epoxide:diol is conserved during MASLD. (a) sEH surrogate 14,15-EET:DHET in liver biopsies stratified according to patients with obesity (N = 22) and patients with obesity and T2DM (N = 11) or MASH [NAS scoring, 0–2 no MASLD (N = 17), 3–4 intermediate/MASLD/MASH (N = 13), 5+ MASH (N = 3)] or ballooning score (0–2; score 0: N = 12, score 1: N = 8, score 2: N = 13) or steatosis score (0–3; score 0: N = 22, score 1: N = 8, score 2: N = 3, score 3: N = 0). (b) Correlation of sEH surrogates, measured in each tissue (liver, plasma, WAT) by UPLC-MS/MS with markers of MASLD, measured by machine learning (See Methods; CPA%, ballooning%, fat%, inflammation %) for each liver biopsy (N = 35). Grey highlights denote significant associations. (c) Schematic summary of CYP-sEH pathway evolution between lean and obese states in the WAT and during WAT inflammation and hepatic steatosis. Significance was tested by student's t-test (2-sided) (a), Kruskal–Wallis followed by Dunn's multiple comparison (a) and Spearman's correlation coefficient (b).

References

    1. Azzu V., Vacca M., Virtue S., Allison M., Vidal-Puig A. Adipose tissue-liver cross talk in the control of whole-body metabolism: implications in nonalcoholic fatty liver disease. Gastroenterology. 2020;158(7):1899–1912. - PubMed
    1. Crewe C., An Y.A., Scherer P.E. The ominous triad of adipose tissue dysfunction: inflammation, fibrosis, and impaired angiogenesis. J Clin Invest. 2017;127(1):74–82. - PMC - PubMed
    1. Kusminski C.M., Bickel P.E., Scherer P.E. Targeting adipose tissue in the treatment of obesity-associated diabetes. Nat Rev Drug Discov. 2016;15(9):639–660. - PubMed
    1. Lumeng C.N., Saltiel A.R. Inflammatory links between obesity and metabolic disease. J Clin Invest. 2011;121(6):2111–2117. - PMC - PubMed
    1. Longo M., Zatterale F., Naderi J., et al. Adipose tissue dysfunction as determinant of obesity-associated metabolic complications. Int J Mol Sci. 2019;20(9) - PMC - PubMed