. 2024 Apr 27;14(1):199.
doi: 10.1038/s41398-024-02907-x.

Exploring the role of neuronal-enriched extracellular vesicle miR-93 and interoception in major depressive disorder

Affiliations

Exploring the role of neuronal-enriched extracellular vesicle miR-93 and interoception in major depressive disorder

Kaiping Burrows et al. Transl Psychiatry. .

Abstract

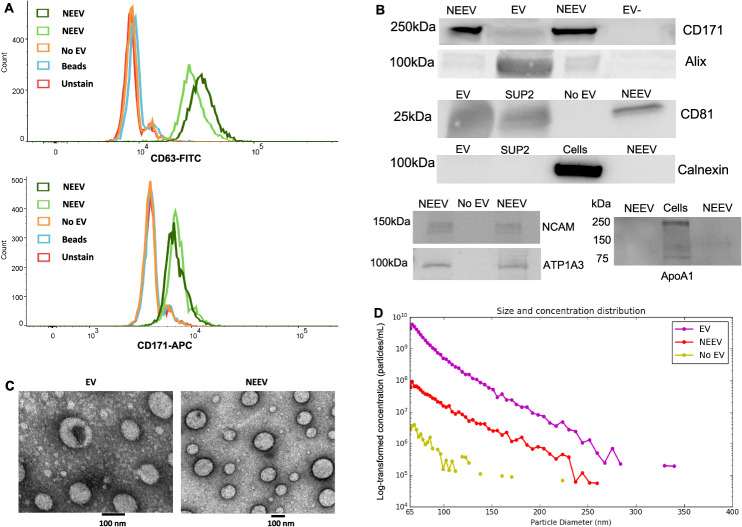
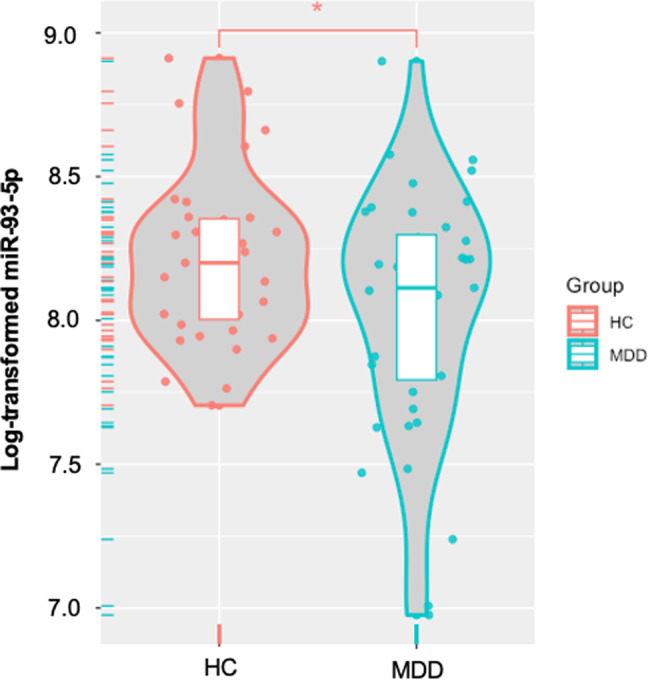
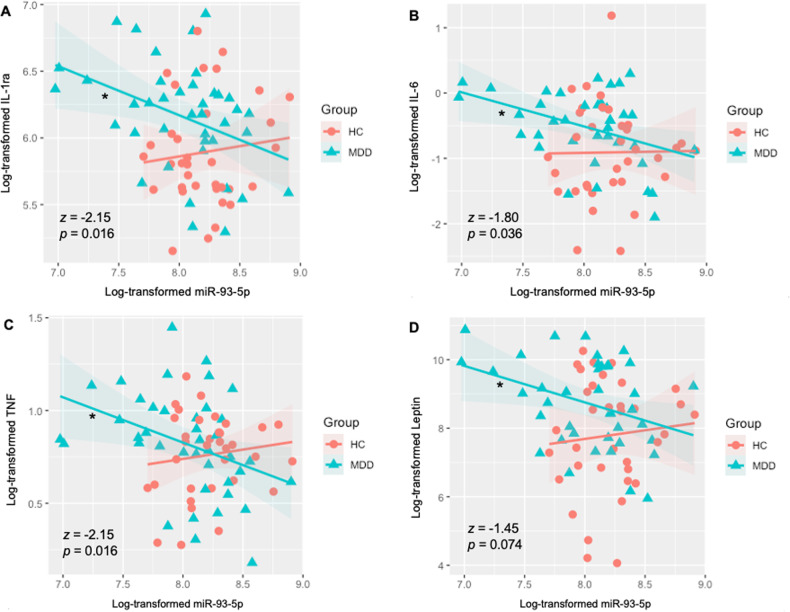
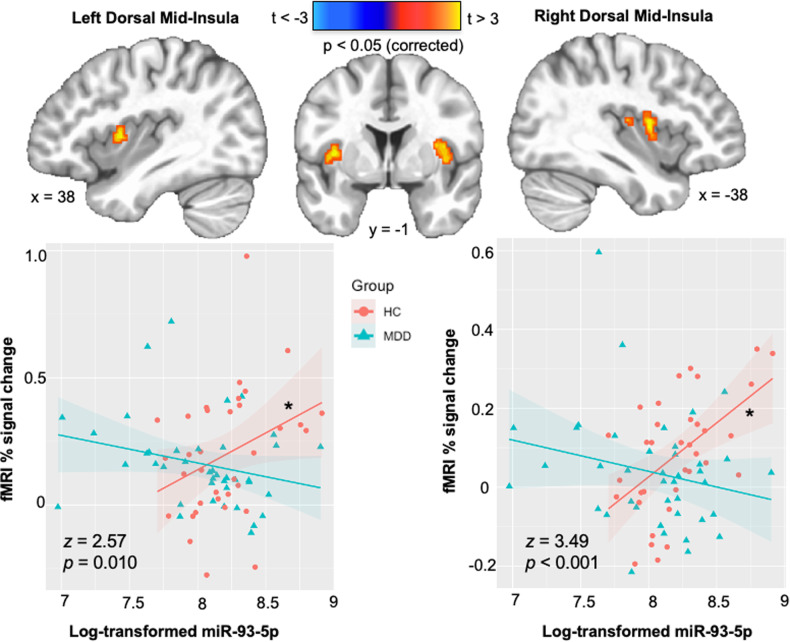
Major depressive disorder (MDD) is associated with interoceptive processing dysfunctions, but the molecular mechanisms underlying this dysfunction are poorly understood. This study combined brain neuronal-enriched extracellular vesicle (NEEV) technology and serum markers of inflammation and metabolism with Functional Magnetic Resonance Imaging (fMRI) to identify the contribution of gene regulatory pathways, in particular micro-RNA (miR) 93, to interoceptive dysfunction in MDD. Individuals with MDD (n = 41) and healthy comparisons (HC; n = 35) provided blood samples and completed an interoceptive attention task during fMRI. EVs were separated from plasma using a precipitation method. NEEVs were enriched by magnetic streptavidin bead immunocapture utilizing a neural adhesion marker (L1CAM/CD171) biotinylated antibody. The origin of NEEVs was validated with two other neuronal markers - neuronal cell adhesion molecule (NCAM) and ATPase Na+/K+ transporting subunit alpha 3 (ATP1A3). NEEV specificities were confirmed by flow cytometry, western blot, particle size analyzer, and transmission electron microscopy. NEEV small RNAs were purified and sequenced. Results showed that: (1) MDD exhibited lower NEEV miR-93 expression than HC; (2) within MDD but not HC, those individuals with the lowest NEEV miR-93 expression had the highest serum concentrations of interleukin (IL)-1 receptor antagonist, IL-6, tumor necrosis factor, and leptin; and (3) within HC but not MDD, those participants with the highest miR-93 expression showed the strongest bilateral dorsal mid-insula activation during interoceptive versus exteroceptive attention. Since miR-93 is regulated by stress and affects epigenetic modulation by chromatin re-organization, these results suggest that healthy individuals but not MDD participants show an adaptive epigenetic regulation of insular function during interoceptive processing. Future investigations will need to delineate how specific internal and external environmental conditions contribute to miR-93 expression in MDD and what molecular mechanisms alter brain responsivity to body-relevant signals.


Conflict of interest statement

The authors declare no competing interests.

Figures

Fig. 1
Fig. 1. Characterization of EV and NEEV.
A Flow cytometry results of neuronal-enriched extracellular vesicles (NEEVs), negative control (No EV), beads and unstained samples with the extracellular vesicle (EV) marker CD63-FITC and NEEV marker CD171-APC. NEEVs were positive for EV marker CD63-FITC and NEEV marker CD171-APC compared to EV-negative control, beads, or unstained samples, as expected. B Western blot analysis of NEEV, EV, and EV negative or positive control with NEEV surface marker CD171, EV surface marker CD81, EV internal marker Alix, EV negative marker Calnexin, additional two neuronal markers – neuronal cell adhesion molecule (NCAM) and ATP1A3, and APOA1 as EV contaminant. Note, EV-: EV-depleted plasma; SUP2: total EV after enrichment; No EV: PBS instead of total EV were used for enrichment. Western blot analysis showed that (1) CD171 marker was enriched in NEEVs; (2) EV surface marker CD81 and EV internal marker Alix were present in EVs and NEEVs; (3) EV negative marker Calnexin was not observed in EV or NEEV samples; (4) other two neuronal markers – NCAM and ATP1A3 were present in NEEVs; and (5) EV contaminant marker APOA1 was not observed in NEEV samples. C Images of EVs and NEEVs with transmission electron microscopy (TEM); images denote a scale bar of 100 nm. D depicts size and concentration analysis of EV, NEEV, and EV-depleted plasma (No EV) using multifluidic resistive pulse sensing (MRPS) with the Spectradyne nCS1TM instrument. MRPS indicates that the majority of EVs and captured NEEVs were in the small EV size range. The average concentration of NEEVs was approximately 1.98 × 10¹⁰ particles per mL, which was approximately 30-fold higher than EV-depleted plasma (6.7 × 10⁸ particles per mL). The approximate concentration of EV used for NEEV enrichment was 9.45 ×10¹⁰ particles per mL. Note: Y-axis is log-transformed concentration (particles/mL).
Fig. 2
Fig. 2. Differential expression of neuronal-enriched extracellular vesicle (NEEV) microRNA-93-5p (miR-93-5p) between MDD and HC groups.
MDD major depressive disorder, HC healthy comparisons. * Indicates that the MDD group exhibited significantly lower levels of NEEV miR-93-5p expression than HC (p < 0.05).
Fig. 3
Fig. 3. Differential associations between neuronal-enriched extracellular vesicle miR-93 and serum IL-1ra, IL-6, TNF, and leptin, in the MDD and HC groups.
A–D Group differences were observed in the slope of the relationship between NEEV miR-93 and all serum markers. Lower NEEV miR-93 expressions were associated with higher serum A IL-1ra, B IL-6, C TNF, and D Leptin concentrations in MDD participants, but no such relationship was observed in HCs. MDD major depressive disorder, HC health comparisons, IL-1ra interleukin-1 receptor antagonist, IL-6 interleukin-6, TNF tumor necrosis factor. z, p, Fisher’s r-to-z transformations (MDD>HC). * indicates a significant correlation within the MDD group.
Fig. 4
Fig. 4. Differential association between neuronal-enriched extracellular vesicle miR-93 and interoception versus exteroception contrast during the interoceptive awareness task in the MDD and HC groups.
MDD major depressive disorder, HC healthy comparisons. Z, p, Fisher’s r-to-z transformations (MDD > HC). * Indicates a significant correlation within the HC group (p < 0.05).

Update of

References

    1. Khalsa SS, Adolphs R, Cameron OG, Critchley HD, Davenport PW, Feinstein JS, et al. Interoception and mental health: a roadmap. Biol Psychiatry Cogn Neurosci Neuroimaging. 2018;3:501–13. - PMC - PubMed
    1. Barrett LF, Quigley KS, Hamilton P. An active inference theory of allostasis and interoception in depression. Philos Trans R Soc Lond B Biol Sci. 2016;371:20160011. doi: 10.1098/rstb.2016.0011. - DOI - PMC - PubMed
    1. Khalsa SS, Lapidus RC. Can interoception improve the pragmatic search for biomarkers in psychiatry? Front Psychiatry. 2016;7:121. doi: 10.3389/fpsyt.2016.00121. - DOI - PMC - PubMed
    1. Paulus MP, Stein MB. Interoception in anxiety and depression. Brain Struct Funct. 2010;214:451–63. doi: 10.1007/s00429-010-0258-9. - DOI - PMC - PubMed
    1. Avery JA, Drevets WC, Moseman SE, Bodurka J, Barcalow JC, Simmons WK. Major depressive disorder is associated with abnormal interoceptive activity and functional connectivity in the insula. Biol Psychiatry. 2014;76:258–66. doi: 10.1016/j.biopsych.2013.11.027. - DOI - PMC - PubMed

Publication types