. 2024 Apr 27;15(1):3593.
doi: 10.1038/s41467-024-47949-3.

Macrophage-fibroblast JAK/STAT dependent crosstalk promotes liver metastatic outgrowth in pancreatic cancer

Affiliations

Macrophage-fibroblast JAK/STAT dependent crosstalk promotes liver metastatic outgrowth in pancreatic cancer

Meirion Raymant et al. Nat Commun. .

Abstract

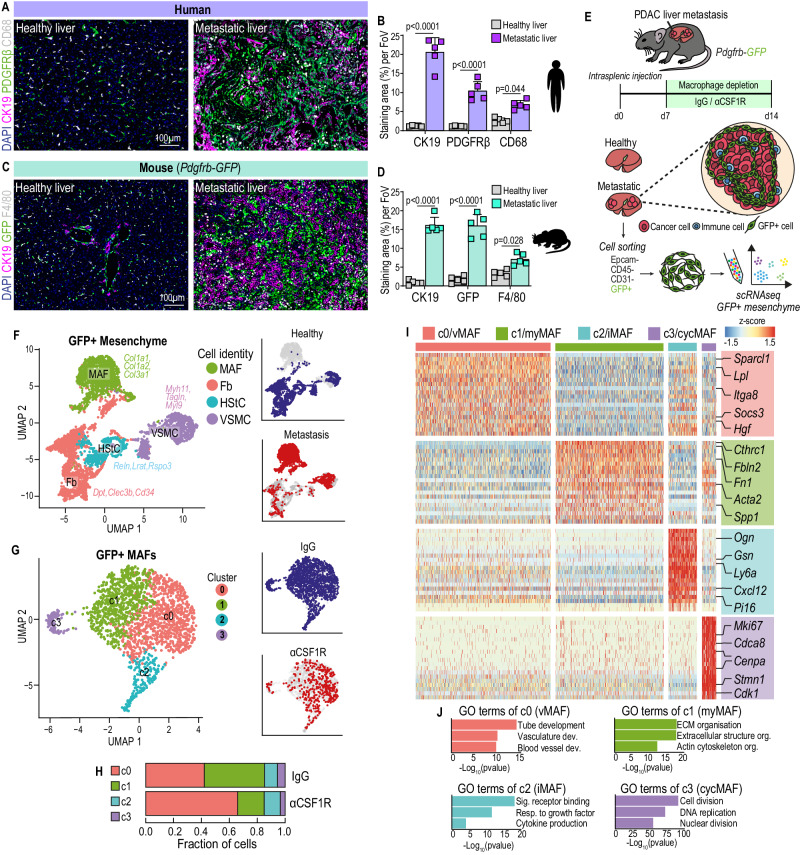
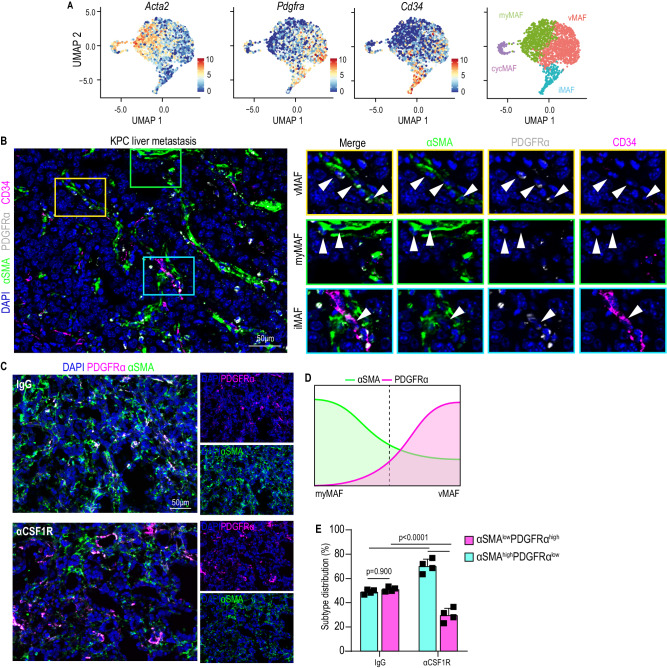
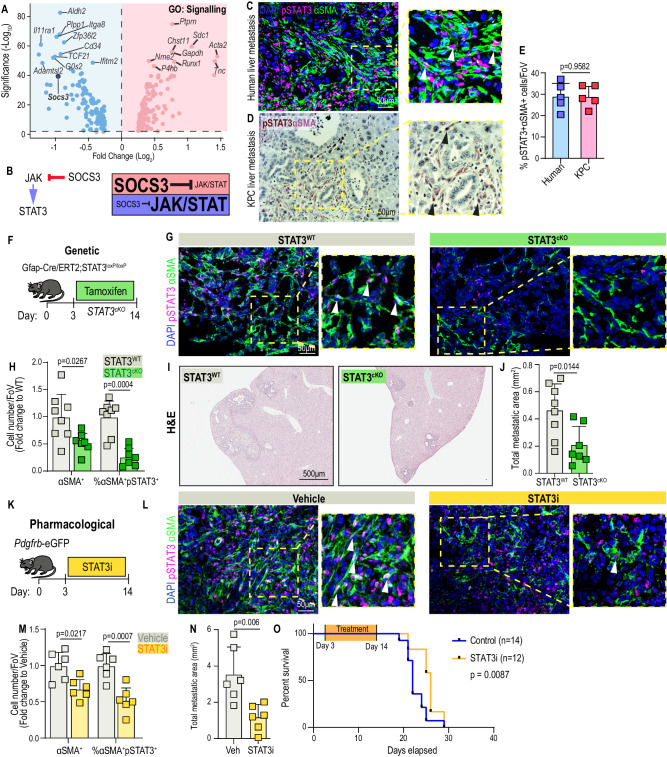
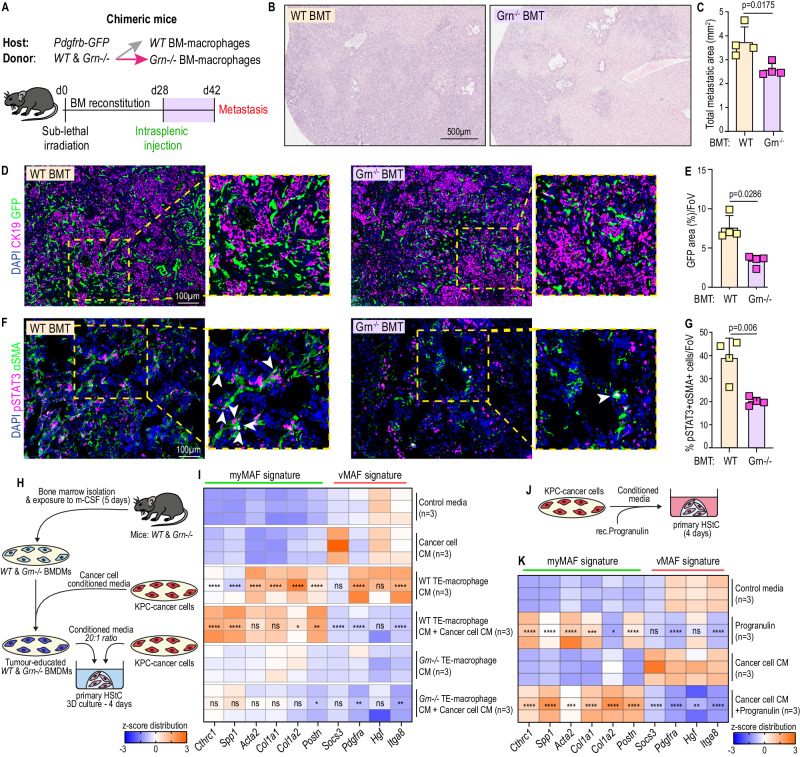
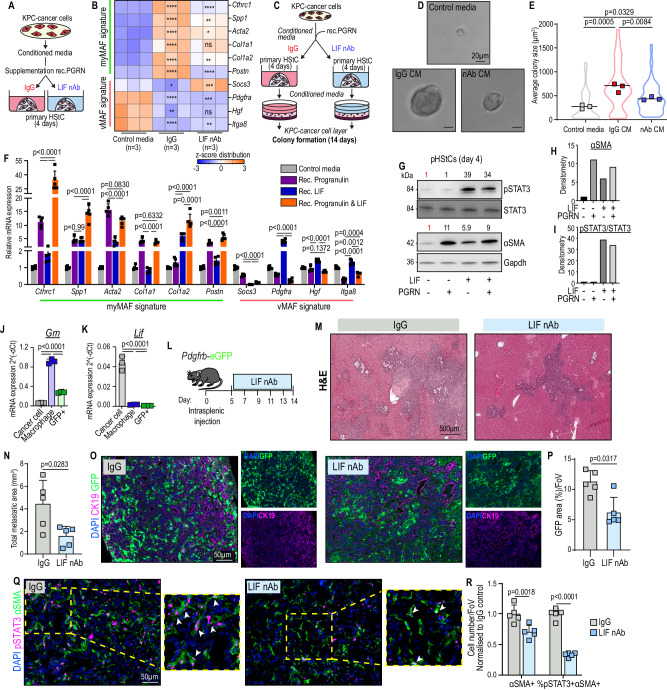
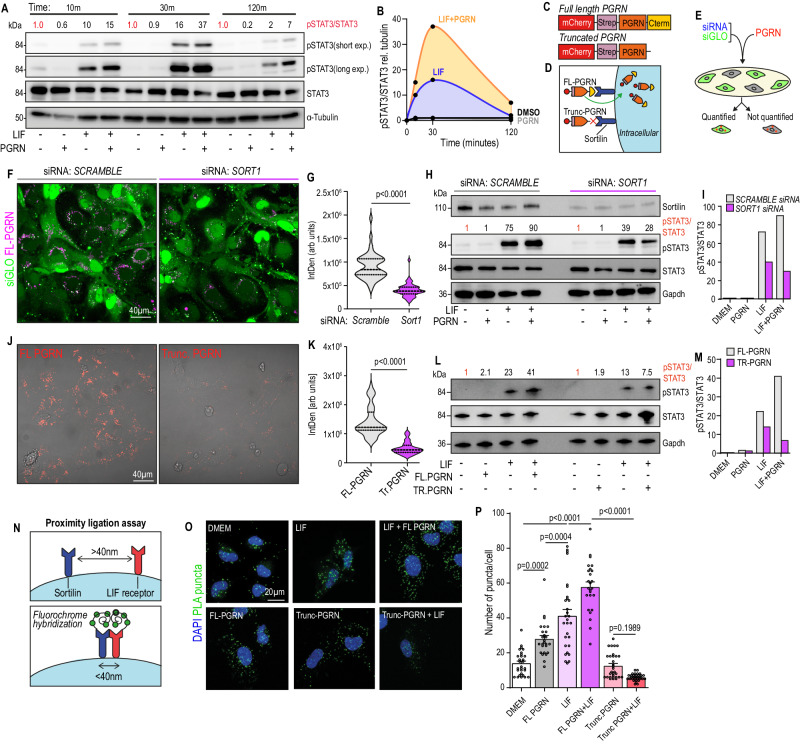
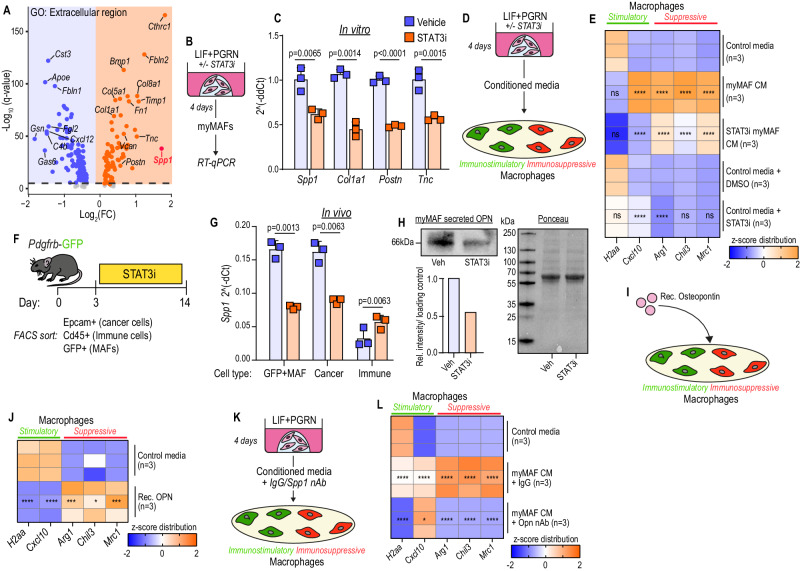
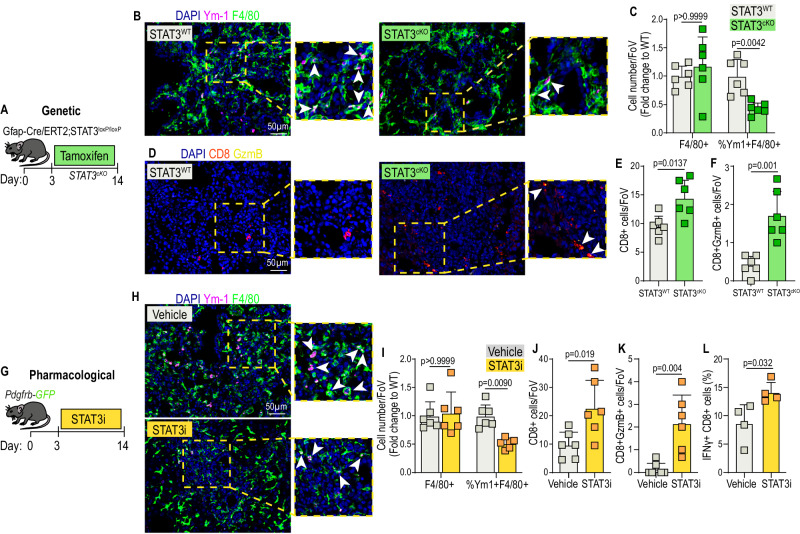
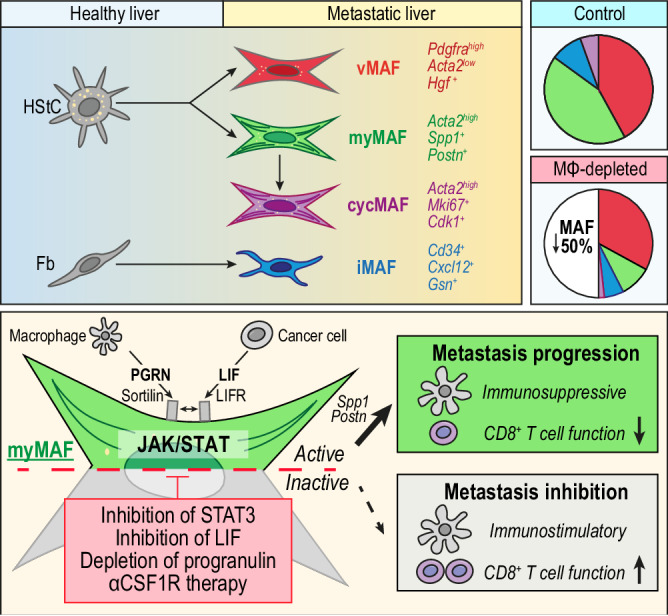
Pancreatic ductal adenocarcinoma (PDAC) is a highly metastatic disease for which better therapies are urgently needed. Fibroblasts and macrophages are heterogeneous cell populations able to enhance metastasis, but the role of a macrophage-fibroblast crosstalk in regulating their pro-metastatic functions remains poorly understood. Here we deconvolve how macrophages regulate metastasis-associated fibroblast (MAF) heterogeneity in the liver. We identify three functionally distinct MAF populations, among which the generation of pro-metastatic and immunoregulatory myofibroblastic-MAFs (myMAFs) critically depends on macrophages. Mechanistically, myMAFs are induced through a STAT3-dependent mechanism driven by macrophage-derived progranulin and cancer cell-secreted leukaemia inhibitory factor (LIF). In a reciprocal manner, myMAF secreted osteopontin promotes an immunosuppressive macrophage phenotype resulting in the inhibition of cytotoxic T cell functions. Pharmacological blockade of STAT3 or myMAF-specific genetic depletion of STAT3 restores an anti-tumour immune response and reduces metastases. Our findings provide molecular insights into the complex macrophage-fibroblast interactions in tumours and reveal potential targets to inhibit PDAC liver metastasis.


Conflict of interest statement

The authors declare no competing interests.

Figures

Fig. 1
Fig. 1. Tumour associated macrophages regulate fibroblast heterogeneity in metastatic PDAC.
Representative immunofluorescence images (A) and quantification of cancer cells (CK19+), mesenchyme (PDGFRβ+), and macrophages (CD68+) (B) in healthy liver or PDAC liver metastasis (n = 5 patients per group). Scale bars, 100 µm. Data presented as mean percentage area. Error bars, SD. P values, two-way ANOVA with Tukey’s multiple comparisons. Representative immunofluorescence images (C) and quantification of cancer cells (CK19+), mesenchyme (GFP+), and macrophages (F4/80+) (D) in healthy liver or PDAC liver metastasis in Pdgfrb-GFP mice (n = 5 mice per group). Scale bars, 100 µm. Data presented as mean percentage area, Error bars, SD. P values, two-way ANOVA with Tukey’s multiple comparisons. E Schematic of scRNA sequencing on GFP+ cells enriched from metastatic livers of Pdgfrb-GFP mice intrasplenically implanted with KPC-derived cancer cells and treated with IgG or αCSF1R. n = 4 mice were pooled per group. F UMAP plot of sequenced GFP+ cells coloured by (left) cell identity, or (right) by origin to healthy or metastatic tissue. G UMAP plot of GFP+ MAFs coloured by (left) cluster identity, or (right) treatment origin. H Bar chart depicting distribution of GFP + MAF clusters in metastatic livers of mice treated with IgG or αCSF1R. I Heat map depicting relative average expression of the top upregulated differentially expressed genes in each GFP + MAF cluster, compared to all other clusters in the scRNA-seq dataset. Representative genes are labelled for each cluster. Z-score distribution from −1.5 (blue) to 1.5 (red). J Gene ontology pathway enrichment analysis of discriminative marker genes of GFP + MAF clusters from G. Statistical enrichment analyses were performed using Fisher’s exact test on g:Profiler. Source data are provided as a Source Data file.
Fig. 2
Fig. 2. Transcriptional and spatially diverse MAF populations co-exist in PDAC liver metastasis.
A UMAP plot depicting expression of Acta2, Pdgfra, and Cd34 in vMAF, myMAF, iMAF, and cycMAF clusters. B Representative immunofluorescence image of annotated MAF subtypes in liver metastasis of KPC mice. Individual MAF subtypes are defined on the representative image in coloured regions: vMAF (αSMALow, PDGFRαHigh, CD34Low) – red; myMAF (αSMAHigh, PDGFRαLow, CD34Low) – green; iMAF (αSMALow, PDGFRαHigh, CD34High) – blue). Arrowheads indicate the defined MAF subtype. N = 3 mice. Scale bar, 50 µm. C Representative immunofluorescence image for the distribution of PDGFRα and and αSMA to discern vMAFs and myMAFs in metastatic tumours derived from Pdgfrb-GFP mice treated with IgG or αCSF1R neutralising antibody. To the right, separated channel images are shown. Scale bar, 50 µm. D Representative schematic depicting how the gradated expression of αSMA and PDGFRα separates across vMAF and myMAF subpopulations, as observed in A, is utilised as a strategy to analyse changes in abundance between both subpopulations. E Quantification of the distribution of αSMAlowPDGFRαhigh and αSMAhighPDGFRαlow cells in C. Data is presented as mean percentage distribution averaged from n = 4 mice per group. Error bars, SD. P values, two-way ANOVA with Tukey’s multiple comparisons test. Source data are provided as a Source Data file.
Fig. 3
Fig. 3. myMAFs support liver metastasis and their pro-metastatic function depends on the activation of JAK/STAT signalling pathway.
A Volcano plot of DEG among myMAFs (vs vMAF;iMAF;cycMAF) enriching for Gene Ontology term: Signalling (GO:0023052). B Illustration of JAK/STAT regulation by SOCS3. High SOCS3, repressed JAK/STAT signalling. Low SOCS3, active JAK/STAT signalling. C Representative immunofluorescence image of JAK/STAT active (pSTAT3+) myMAFs (αSMA+) in human PDAC liver metastasis. Arrowheads, double positive cells. Scale bar, 50 μm. D Representative immunohistochemical image of JAK/STAT active (pSTAT3+; DAB, brown) myMAFs (αSMA+; VIP purple) in spontaneous liver metastasis of KPC mice. Arrowheads indicate double positive cells. Scale bar, 50 µm. E Mean percentage of pSTAT3+αSMA+ cells, among all αSMA+ cells, depicted in C and D. N = 5 independent samples. Error bars, SD. P value, two-tailed unpaired t-test. F Experimental design for generating metastasis bearing GFAP-STAT3 conditional knockout mice (STAT3cKO). G Representative immunofluorescence images of JAK/STAT active (pSTAT3+) myMAFs (αSMA+) in metastatic tumours of STAT3WT and STAT3cKO mice. Arrowheads, double-positive cells. Scale bar, 50 µm. H Mean percentage of αSMA+, and percentage of pSTAT3+αSMA+ cells, presented as fold change relative to STAT3WT. n = 8 STAT3WT, n = 7 STAT3cKO mice. Error bars, SD. P value, two-way ANOVA with Tukey’s multiple comparisons. Representative H&E staining (I) and average sum of metastatic area per group (J). Scale bar, 500 µm. n = 8 STAT3WT, n = 7 STAT3cKO mice. Error bars, SD. P value, two-tailed unpaired t-test. K Experimental design for pharmacological inhibition of pSTAT3 with Silibinin (STAT3i), in Pdgfrb-GFP mice. L Representative immunofluorescence images of JAK/STAT active (pSTAT3+) myMAFs (SMA+) in metastatic tumours of vehicle or STAT3i-treated mice. Arrowheads indicate double-positive cells. Scale bar, 50 µm. M Mean percentage of αSMA+, and percentage of pSTAT3+αSMA+ cells, presented as fold change relative to control. n = 6 mice per group. Error bars, SD. P value, two-way ANOVA with Tukey’s multiple comparisons. N Average sum of metastatic area per group. n = 6 mice per group. Error bars, SD. P value, two-tailed unpaired t-test. O Kaplan–Meier survival analysis of metastasis-bearing mice treated with vehicle (n = 14) or STAT3i (n = 12). P value, log-rank test and Cox proportional hazards test. Source data are provided as a Source Data file.
Fig. 4
Fig. 4. Co-stimulation of progranulin and cancer-cell derived factors promote myMAF activation.
A Generation of chimeric Pdgfrb-GFP mice with either WT, or Grn−/−, bone marrow (BM) reconstitution. WT and Grn−/− BM transplanted mice were implanted with KPC cells and terminated after 14 days. Representative H&E staining (B) and quantification of the average sum of metastatic area per group (C). Scale bar, 500 µm. n = 4 mice per group. Error bars, SD. P value, two-tailed unpaired t-test. Representative immunofluorescence image (D) and quantification of MAFs (GFP+) among metastatic tumours (CK19+) of WT and Grn−/− BM Pdgfrb-GFP mice (E). Scale bar, 100 µm. n = 4 mice per group. Data is presented as mean GFP percentage area. Error bars, SD. P value, two-tailed Mann–Whitney test. Representative immunofluorescence image (F) and quantification (G) of JAK/STAT active (pSTAT3+) myMAFs (αSMA+). Arrowheads, double positive cells. Scale bar, 100 µm. n = 4 mice per group. Data is presented as average percentage of pSTAT3+αSMA+ cells, among αSMA+ cells. Error bars, SD. P value, two-tailed unpaired t-test. H Schematic of experimental design. Bone marrow-derived macrophages were generated from WT and Grn−/− mice and educated with cancer cell CM for 24 h. Primary HStCs were exposed to conditioned media from tumour educated macrophages and cancer cells, alone or in combination, for 4 days. I Heatmap of selected myMAF and vMAF gene signature expression in primary HStCs stimulated as outlined in H. N = 3 independent experiments. P value, one-way ANOVA with Tukey’s multiple comparisons. Significance shown depict: WT TE-Macrophage CM vs Control media; WT TE-Macrophage CM+ Tumour CM vs WT TE-Macrophage CM; Grn−/− TE-Macrophage CM+ Tumour CM vs Grn−/− TE-Macrophage CM. TE Tumour educated. J Schematic of experimental design. Primary HStCs were exposed to cancer cell CM supplemented with recombinant progranulin for 4 days. K Heatmap of selected myMAF and vMAF gene signature expression in primary HStCs stimulated as outlined in J. n = 3 independent experiments. P value, one-way ANOVA with Tukey’s multiple comparisons. Significance shown, Progranulin vs Control media; Cancer cell CM+ Progranulin vs Cancer cell CM. Source data and exact p values are provided as a Source Data file.
Fig. 5
Fig. 5. Neutralisation of cancer-cell derived LIF represses the activation of pSTAT3+myMAFs and inhibits metastatic outgrowth.
Schematic of experiment (A) and qPCR (B) of vMAF and myMAF genes. Data is presented as heatmap of z-scores. n = 3 independent experiments. P value, one-way ANOVA with Tukey’s multiple comparisons. Significance shown: IgG vs Control media; LIF-nAb vs IgG. Schematic of experimental design (C) and representative images (D) of colony formation. Scale bar: 20 µm. E Quantification of average colony size presented as average from n = 3 independent biological experiments. P value, one-way ANOVA with Tukey’s multiple comparisons. F qPCR of myMAF and vMAF genes in primary HStCs stimulated with Progranulin, LIF, or both. Data represents average fold change. n = 5 independent experiments. Error bars, SD. P value, one-way ANOVA with Tukey’s multiple comparisons. G–I Immunoblotting (I) of primary HStCs stimulated with Progranulin, LIF, or both, and densitometric analysis of (H) αSMA and (I) pSTAT3/STAT3 activity relative to Gapdh. Experiment was repeated three times with similar results. qPCR of (J) Grn and (K) Lif mRNA expression in Cancer cells, Macrophages, and MAFs isolated from metastasis bearing Pdgfrb-GFP mice. n = 3 independent mice. Error bars, SD. P value, one-way ANOVA with Tukey’s multiple comparisons. L Schematic of experimental design to treat metastasis-bearing Pdgfrb-GFP mice with IgG or LIF-nAb. Representative H&E staining (M) and quantification (N) of average metastatic area from IgG and LIF-nAb treated mice. Scale bar: 500 µm. n = 5 mice per group. Error bars, SD. P value, two-tailed unpaired t-test. Representative immunofluorescence image (O) and quantification (P) of MAFs (GFP+) among metastatic tumours (CK19+) of IgG and LIF-nAb treated mice. Scale bar, 50 µm. n = 5 mice per group. Data represents average percentage area of GFP. Error bars, SD. P value, two-tailed Mann–Whitney test. Representative immunofluorescence image (Q) and quantification (R) of αSMA+, and percentage of pSTAT3+αSMA+ cells, presented as average fold change relative to control, in IgG and LIF-nAb treated mice. Scale bar: 50 µm. Arrowheads indicate double positive cells. n = 5 mice per group. Error bars, SD. P value, two-way ANOVA with Tukey’s multiple comparisons. Source data and exact p values are provided as a Source Data file.
Fig. 6
Fig. 6. The binding of progranulin to Sortilin enhances Sortilin-LIFR proximity, leading to STAT3 hyperactivation in HStCs.
Immunoblot (A) and densitometric quantification (B) of pSTAT3/STAT3, relative to α-tubulin. Experiment was performed three times with similar results. Schematic (C) of recombinant full length (FL) progranulin, or progranulin lacking the C-term tail (Trunc PGRN) constructs, with an mCherry-StreptagII, and (D) illustration depicting Sortilin-mediated uptake of progranulin, via C-terminus end. E Schematic of experimental design for pre-treatment of LX2 cells with SCRAMBLE or SORT1 siRNA, and siGLO transfection reagent, prior stimulating with FL-progranulin. Representative images (F) and quantification (G) of FL-progranulin uptake (FL-PGRN+) in successfully transfected (siGLO+) LX2 cells. Scale bar, 40 µm. siRNA: SCRAMBLE, n = 48 cells. siRNA: SORT1, n = 47 cells. Distribution of data presented as violin plot. P value, two-tailed Mann–Whitney test. Immunoblot (H) and densitometric quantification of pSTAT3/STAT3 relative to GAPDH (loading control) (I) in LX2 cells pre-treated with SORT1 siRNA and stimulated with LIF in the presence or absence of progranulin, for 30 min. Successful receptor knockdown was validated by protein detection of sortilin. Experiment was performed three times with similar results. Representative images (J) and quantification (K) of the uptake of FL-progranulin (n = 51) and Trunc-progranulin (n = 35) (m-cherry; Red) in LX2 cells. Scale bar: 40 µm. Distribution of data presented as violin plots. P value, two-tailed Mann–Whitney test. Immunoblot (L) and densitometric quantification of pSTAT3/STAT3 relative to GAPDH (M) in LX2 cells stimulated with LIF in the presence or absence of FL- or Trunc-progranulin, for 30 min. Experiment was performed three times with similar results. N Illustration depicting the mechanism of duolink Proximity Ligation Assay. Two antibody-labelled proteins of interest, Sortilin and LIF receptor, generate a fluorescently detectable signal, visible as a single punctum, only when residing within 40 nm of each other. Representative fluorescence images (O) and quantification (P) of average number of puncta (PLA+) in LX2 cells stimulated with DMEM (n = 29), LIF (n = 29), FL-PGRN (n = 26), LIF + FL-PGRN (n = 25), Trunc-PGRN (n = 31), or LIF+Trunc-PGRN (n = 32). Scale bar: 20 µm. Error bars, SD. P value, one-way ANOVA with Tukey’s multiple comparisons. Source data are provided as a Source Data file.
Fig. 7
Fig. 7. STAT3 activated myMAFs secrete Osteopontin (Spp1), which in turn supports immunosuppressive macrophage functions.
A Volcano plot of DEG among myMAFs (vs vMAF;iMAF;cycMAF) enriching for Gene Ontology term: Extracellular region (GO:0005576). Schematic of experimental design (B) and qPCR (C) of selected upregulated genes identified in A. Data is presented as average fold change. N = 3 independent experiments. Error bars, SD. P value, two-tailed unpaired t-test. Schematic of experimental design (D) and qPCR (E) of immunostimulatory and immunosuppressive markers. Data is presented as a heatmap of z-scores. N = 3 independent experiments per group. P value, two-way ANOVA with Tukey’s multiple comparisons. Significance shown depict: myMAF CM vs Control media; STAT3i myMAF CM vs myMAF CM; Control media + STAT3i vs Control media + DMSO. Schematic of experimental design (F) and qPCR (G) of relative Spp1 expression, presented as mean fold change, in sorted cell populations. N = 3 independent experiments per group. Error bars, SD. P value, Two-way ANOVA with Tukey’s post hoc test. H Immunoblot of secreted osteopontin from pSTAT3+myMAF CM, generated as illustrated in D. Below left, densitometric analysis of relative intensity normalised to ponceau stain (right). Experiment was performed three times with similar results. Illustration of the experimental design (I) and qPCR (J) of immunostimulatory and immunosuppressive markers in BMMs stimulated with recombinant Osteopontin. Data is presented as a heatmap of z-scores. N = 3 independent experiments per group. P value, two-tailed unpaired t-tests. Illustration of the experimental design (K) and qPCR (L) of immunostimulatory and immunosuppressive markers in BMMs exposed to myMAF CM in the presence or absence of Osteopontin nAb. Data is presented as a heatmap of z-scores. N = 3 independent experiments per group. P value, one-way ANOVA with Sidak’s multiple comparisons. Significance shown depicts: myMAF CM + IgG vs Control media; myMAF CM + Opn nAb vs myMAF CM + IgG. Source data and exact p values are provided as a Source Data file.
Fig. 8
Fig. 8. myMAFs orchestrate an immunosuppressive microenvironment in a STAT3-dependent manner in metastatic PDAC.
A Experimental design for generating metastasis bearing GFAP-STAT3 conditional knockout mice (STAT3cKO). B Representative immunofluorescence images of immunosuppressive (Ym-1+) macrophages (F4/80+) in metastatic tumours of STAT3WT and STAT3cKO mice. Arrowheads indicate double-positive cells. Scale bar, 50 µm. C Quantification of F4/80+, and percentage of Ym-1 + F4/80+ cells, presented as average fold change relative to STAT3WT. n = 6 mice per group. Error bars, SD. P value, two-way ANOVA with Tukey’s multiple comparisons. D Representative immunofluorescence images of cytotoxic (Gzmb+) T cells (CD8+) in metastatic tumours of STAT3WT and STAT3cKO mice. Arrowheads indicate double-positive cells. Scale bar, 50 µm. Quantification of total infiltrating (E) and cytotoxic (F) CD8+ cells, presented as average cells per field of view. N = 6 mice per group. Error bars, SD. P value, two-tailed unpaired t-test. G Experimental design for pharmacological inhibition of pSTAT3 with Silibinin (STAT3i), in Pdgfrb-GFP mice. H Representative immunofluorescence images of immunosuppressive (Ym-1+) macrophages (F4/80+) in metastatic tumours of vehicle or STAT3i-treated mice. Arrowheads indicate double-positive cells. Scale bar, 50 µm. I Quantification of F4/80+, and percentage of Ym-1 + F4/80+ cells, presented as average fold change relative to vehicle control. n = 6 mice per group. Error bars, SD. P value, two-way ANOVA with Tukey’s multiple comparisons. Quantification of total infiltrating (J) and cytotoxic (K) CD8+ cells, presented as average cells per field of view. N = 6 mice per group. Error bars, SD. P value, two-tailed unpaired t-test. L Percentage of IFNγ+ cells, among CD8+ T cells, determined by flow cytometry analysis. Data is presented as mean from n = 4 mice per group. Error bars, SD. P value, two-tailed unpaired t-test. Source data are provided as a Source Data file.
Fig. 9
Fig. 9. Schematic depicting MAF diversity and the pro-metastatic functions of pSTAT3+myMAFs.
Illustration depicting the proposed cellular origin, subtyping, distribution, and mechanism of myMAF activation. In established liver metastatic PDAC, HStCs give rise to vMAFs, myMAFs, and cycMAFs, while portal fibroblasts give rise to iMAFs. In tumour bearing control mice, vMAFs and myMAFs are dominant, whereas iMAFs and cycMAFs are minor populations. In macrophage depleted mice (αCSF1R-treated) an overall reduction in fibrosis is primarily driven by the loss of myMAFs, resulting in an imbalance of vMAF/myMAF ratio. Mechanistically, progranulin and LIF, mainly derived from macrophages and cancer cells, respectively, co-opt to promote a myMAF phenotype via activation of JAK/STAT signalling. Progranulin binding to sortilin enhances the proximity of sortilin to LIFR, leading to JAK/STAT hyperactivation. Reciprocally, myMAF secreted periostin directly promotes cancer cell proliferation, whereas myMAF secreted osteopontin promotes an immunosuppressive macrophage phenotype. Pharmacological or genetic interference of cancer cell-macrophage-MAF crosstalk ablates the metastasis promoting functions of pSTAT3+myMAFs in metastatic PDAC.

References

    1. Siegel RL, Miller KD, Fuchs HE, Jemal A. Cancer statistics, 2022. CA Cancer J. Clin. 2022;72:7–33. doi: 10.3322/caac.21708. - DOI - PubMed
    1. Werner J, et al. Advanced-stage pancreatic cancer: therapy options. Nat. Rev. Clin. Oncol. 2013;10:323–333. doi: 10.1038/nrclinonc.2013.66. - DOI - PubMed
    1. Mielgo A, Schmid MC. Liver Tropism in Cancer: The Hepatic Metastatic Niche. Cold Spring Harb. Perspect. Med. 2020;10:a037259. doi: 10.1101/cshperspect.a037259. - DOI - PMC - PubMed
    1. Massagué J, Obenauf AC. Metastatic colonization by circulating tumour cells. Nature. 2016;529:298–306. doi: 10.1038/nature17038. - DOI - PMC - PubMed
    1. Hanahan D, Coussens, Lisa M. Accessories to the Crime: Functions of Cells Recruited to the Tumor Microenvironment. Cancer Cell. 2012;21:309–322. doi: 10.1016/j.ccr.2012.02.022. - DOI - PubMed

Publication types

MeSH terms