. 2024 Apr 27;15(1):3600.
doi: 10.1038/s41467-024-47928-8.

The hinge-engineered IgG1-IgG3 hybrid subclass IgGh47 potently enhances Fc-mediated function of anti-streptococcal and SARS-CoV-2 antibodies

Affiliations

The hinge-engineered IgG1-IgG3 hybrid subclass IgGh47 potently enhances Fc-mediated function of anti-streptococcal and SARS-CoV-2 antibodies

Arman Izadi et al. Nat Commun. .

Abstract

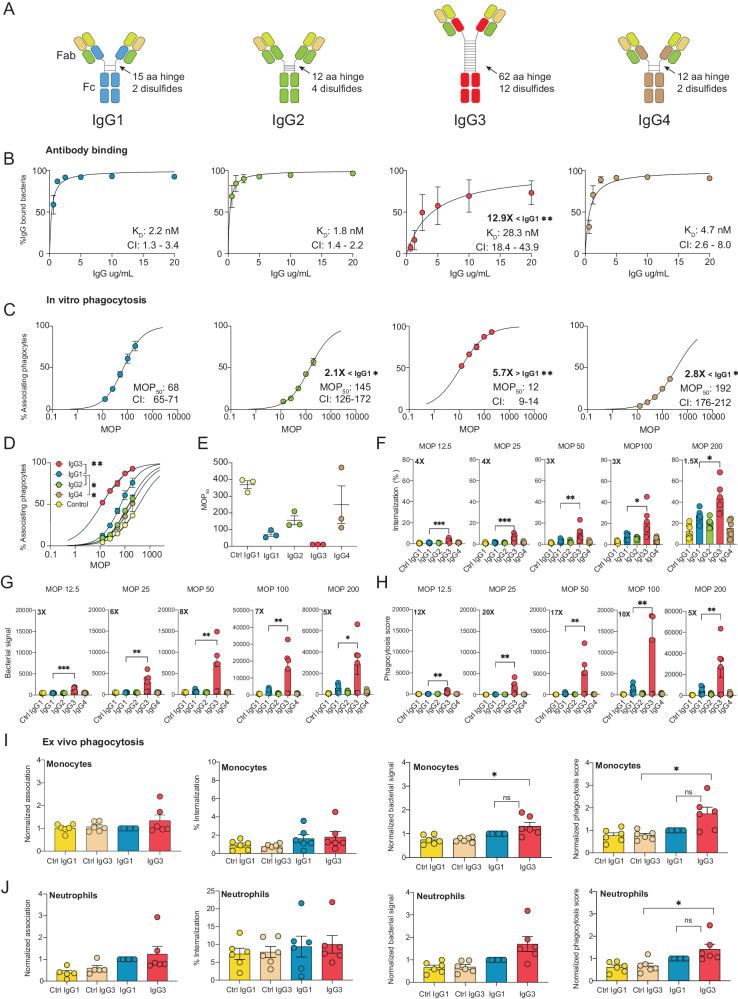
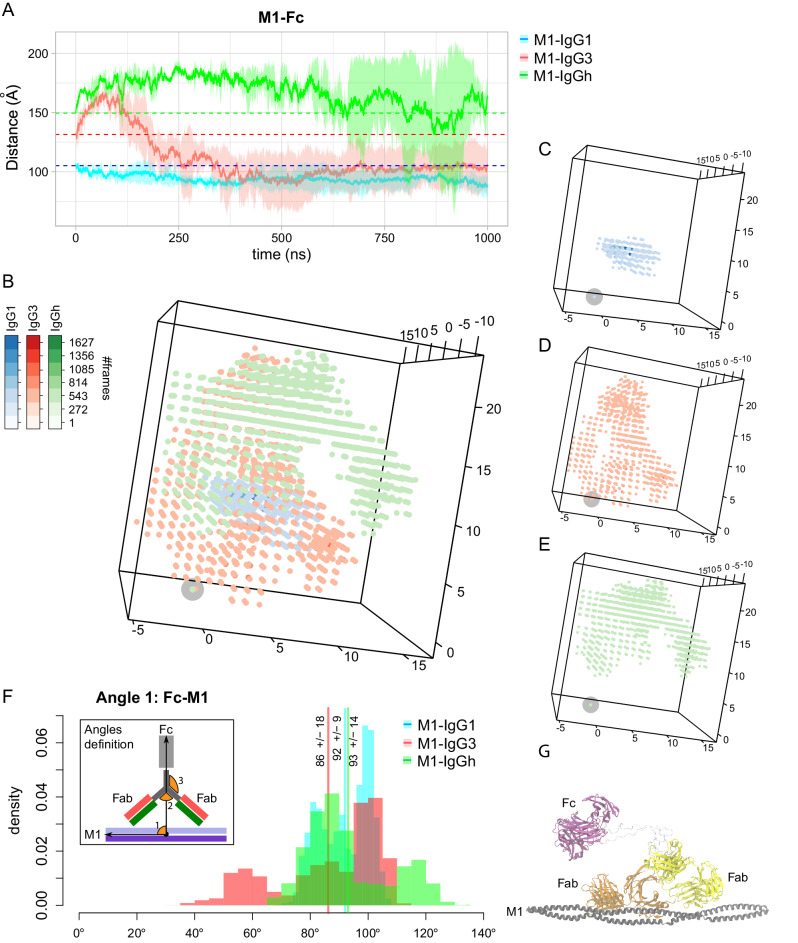
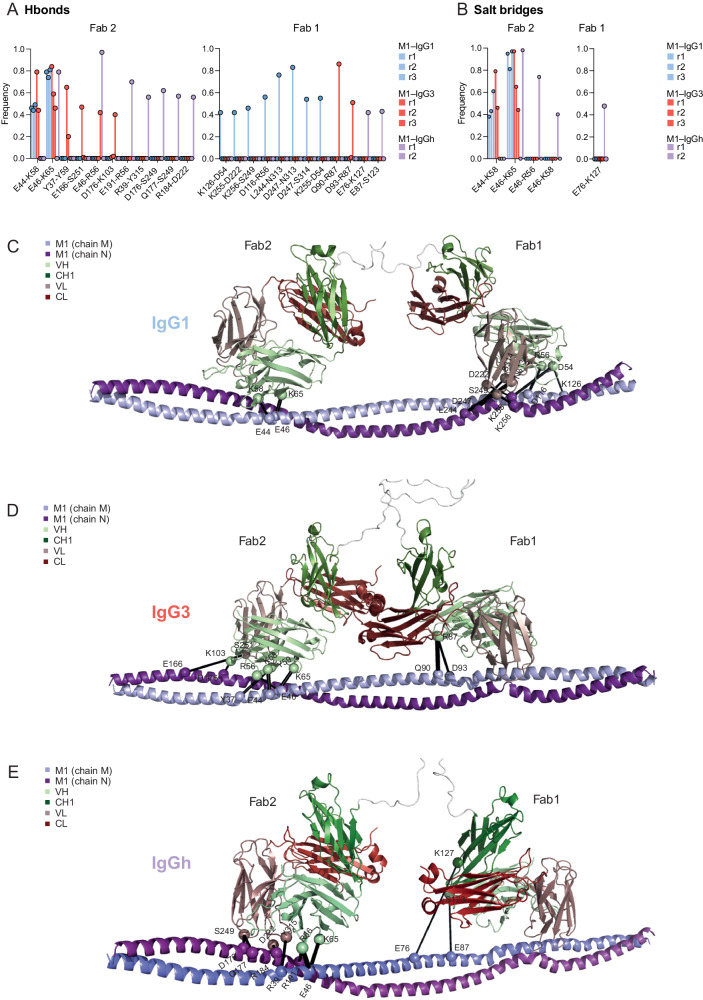
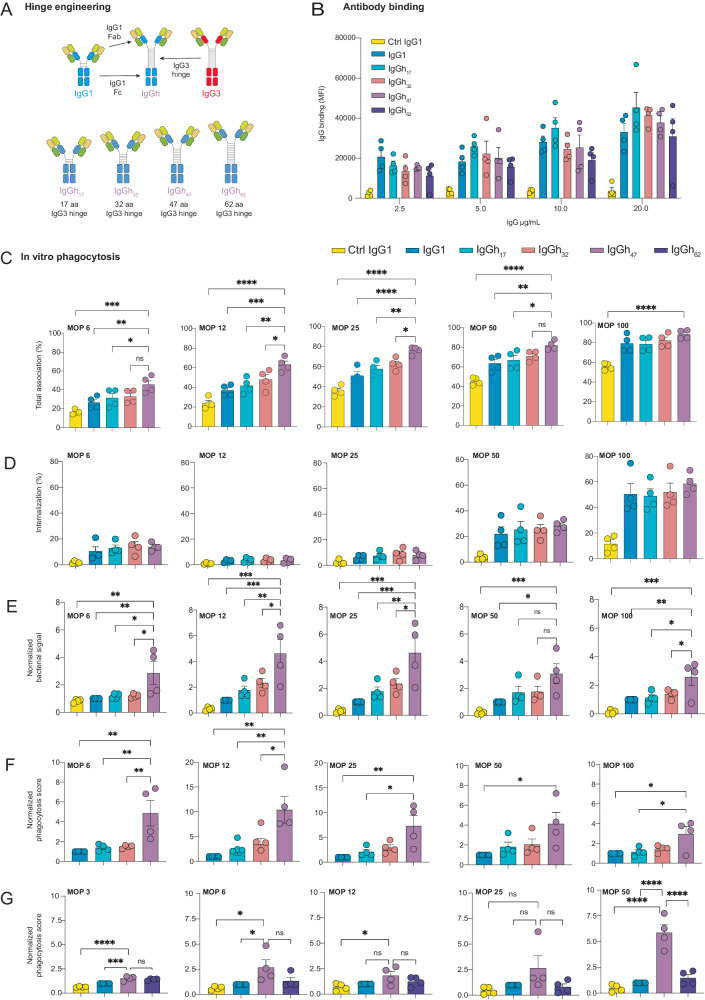
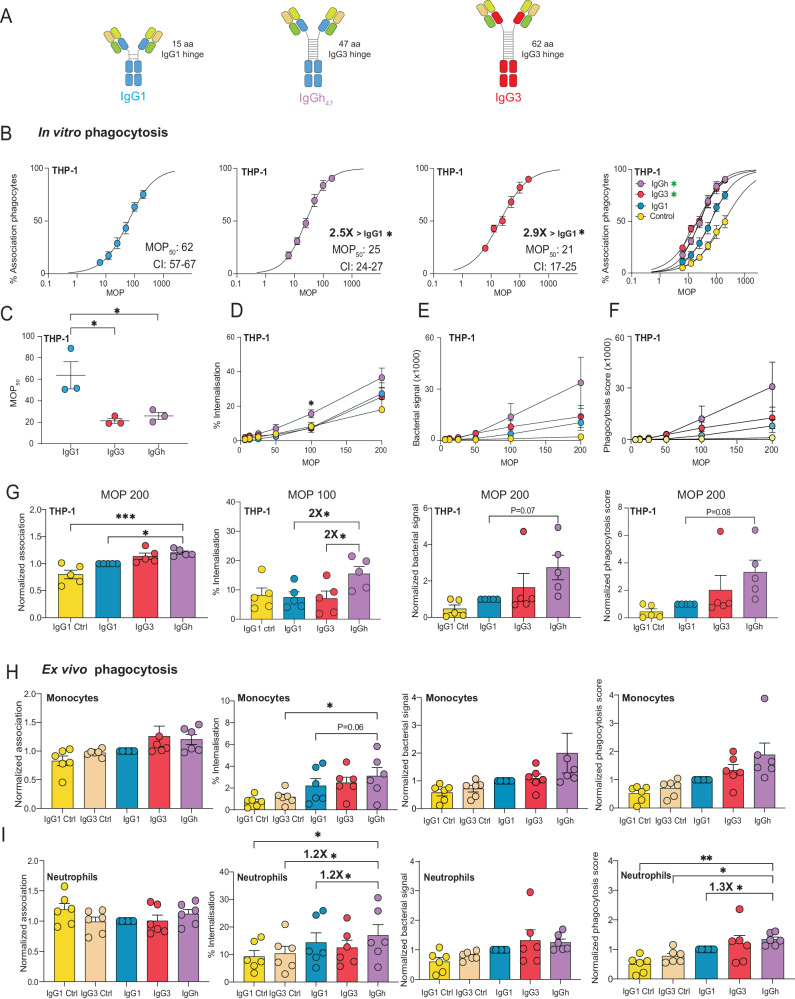
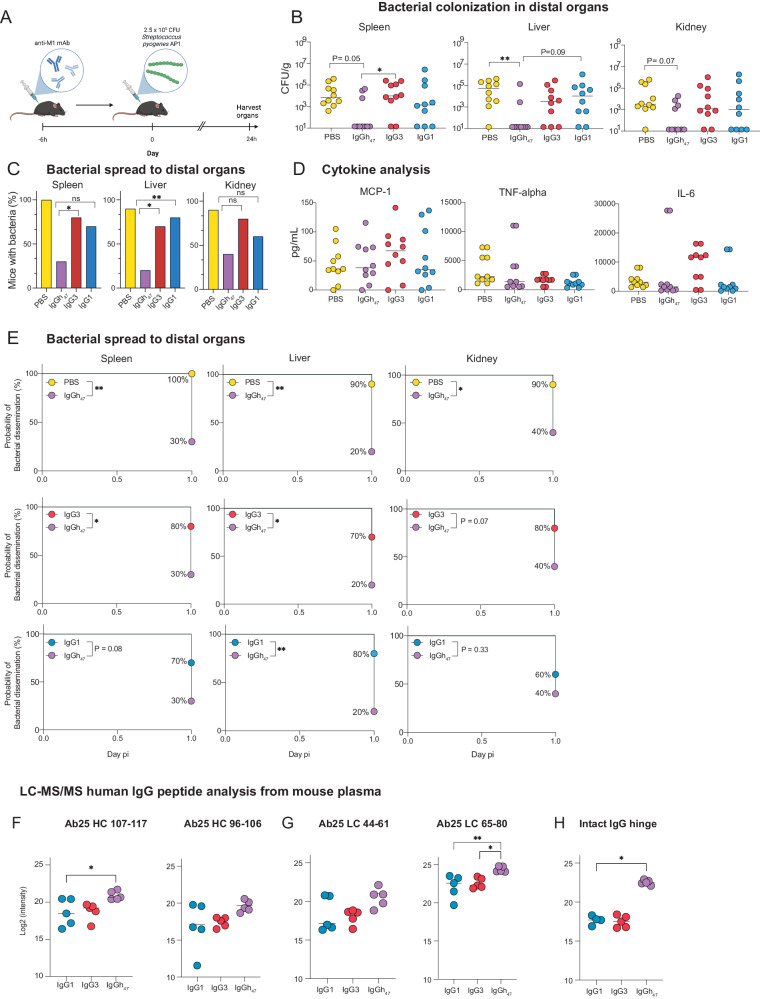
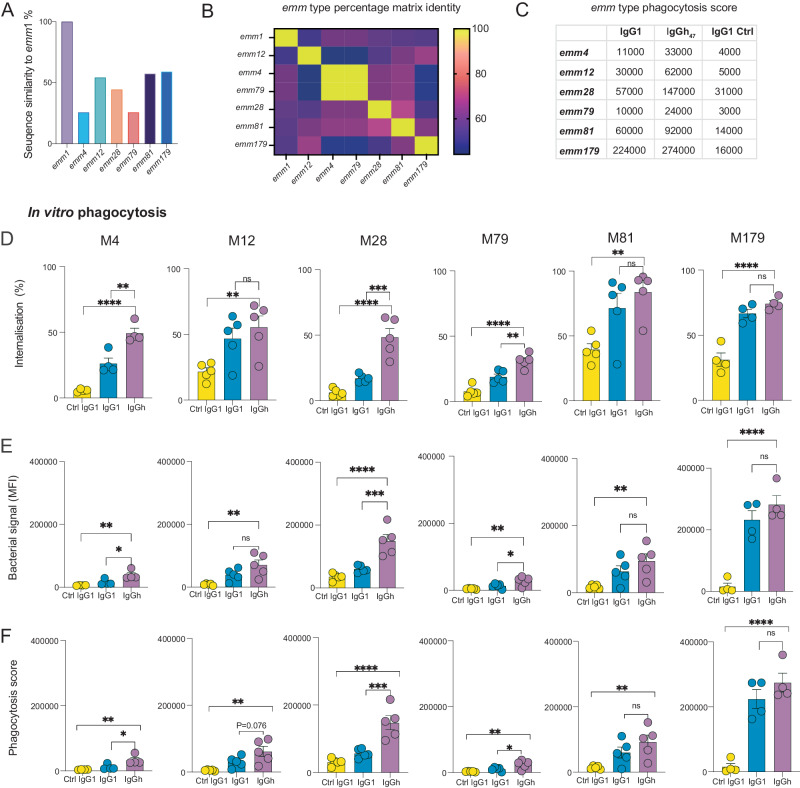
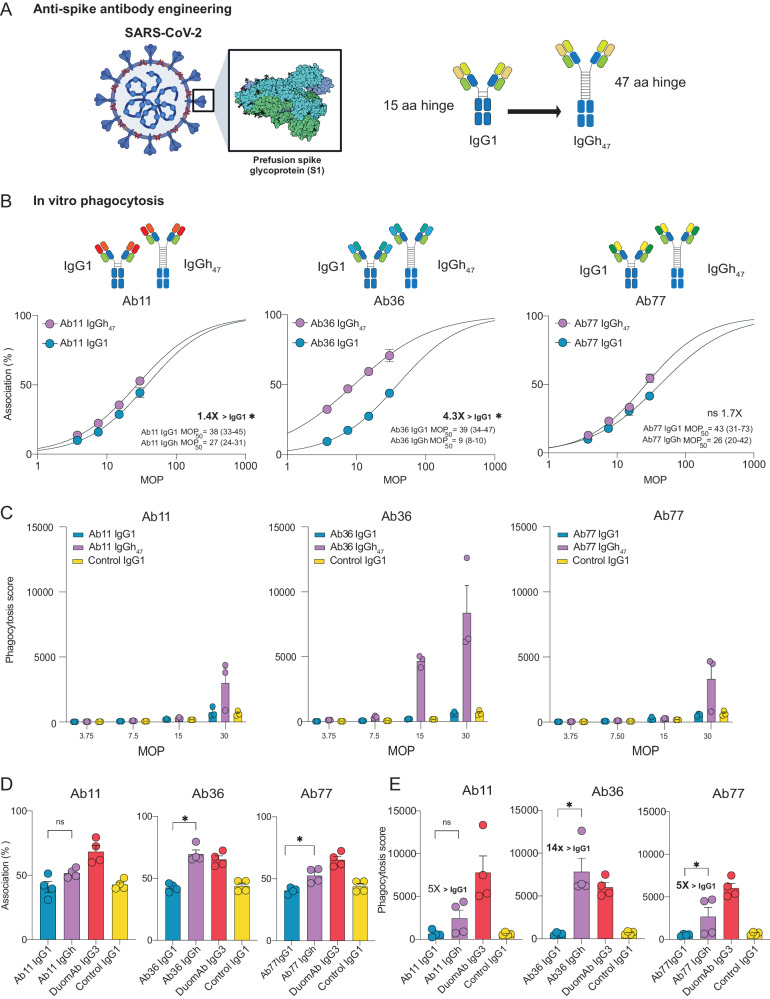
Streptococcus pyogenes can cause invasive disease with high mortality despite adequate antibiotic treatments. To address this unmet need, we have previously generated an opsonic IgG1 monoclonal antibody, Ab25, targeting the bacterial M protein. Here, we engineer the IgG2-4 subclasses of Ab25. Despite having reduced binding, the IgG3 version promotes stronger phagocytosis of bacteria. Using atomic simulations, we show that IgG3's Fc tail has extensive movement in 3D space due to its extended hinge region, possibly facilitating interactions with immune cells. We replaced the hinge of IgG1 with four different IgG3-hinge segment subclasses, IgGhxx. Hinge-engineering does not diminish binding as with IgG3 but enhances opsonic function, where a 47 amino acid hinge is comparable to IgG3 in function. IgGh47 shows improved protection against S. pyogenes in a systemic infection mouse model, suggesting that IgGh47 has promise as a preclinical therapeutic candidate. Importantly, the enhanced opsonic function of IgGh47 is generalizable to diverse S. pyogenes strains from clinical isolates. We generated IgGh47 versions of anti-SARS-CoV-2 mAbs to broaden the biological applicability, and these also exhibit strongly enhanced opsonic function compared to the IgG1 subclass. The improved function of the IgGh47 subclass in two distant biological systems provides new insights into antibody function.


Conflict of interest statement

AI, HK, WB, LH, OS, JM, LM, and PN have filed patents related to the mAbs described in this manuscript. The remaining authors declare no competing interests.

Figures

Fig. 1
Fig. 1. IgG3 exhibits potent phagocytosis efficacy despite reduced antigen binding.
A The four subclasses of Ab25. The constant domains of the heavy chains are depicted in different colors. B The Y-axis shows percentage of IgG+ bacteria. The KD values (nM) with a 95% confidence interval (CI) are shown in each graph with statistical significance up to 99% CI compared to IgG1 due to non-overlapping CIs. C MOP50 curves of the subclasses, bacteria were opsonized with 15 μg/mL of IgG. The Y-axis shows the percentage of bacteria+ THP-1 cells, while X-axis depicts the ratio of bacteria to phagocytes added (MOP). The MOP50 values with a 95% CI are shown in each graph with statistical significance shown up to 99% CI compared to IgG1. The data points from (B) to (C) are from N = 3 independent experiments. D Shows the MOP50 curves of all the antibody treatments in one graph. Statistical significance compared to IgG1 is ** for IgG3 (99% CI) * for IgG2 and IgG4 (95% CI). E Individual MOP50 values from the N = 3 independent experiments. F Percentage of THP-1 cells with internalized bacteria across an MOP range. G Amount of bacteria phagocytosed by the whole THP-1 cell population measured as median MFI of bacterial signal across MOP range. H Phagocytosis score for each mAb treatment across MOP 200-12.5. In (F)–(H) statistically significant fold-change differences between IgG3 and IgG1 are highlighted in each graph. I, J Ex vivo phagocytosis with neutrophils and monocytes, respectively, at MOP 25. For (I) and (J), repeated measures one-way ANOVA was used with Dunnett’s post hoc test after multiple comparisons and compared against IgG3. The data points in (B)–(J) represent the mean value, and the error bars are in SEM. The phagocytosis score seen in (I) and (J) is normalized to Ab25 IgG1 for each experiment. In (F)–(J) N = 6 independent experiments were performed. R2 = 0.99 for all non-linear regression curves. Statistical analyses for (F)–(H) were done by comparing IgG1 with one-way ANOVA multiple comparisons corrected by Dunnett’s correction test. * denotes p-value < 0.05, ** denotes p-value < 0.01, and p-value > 0.05 is ns. Source data are provided as a Source Data file.
Fig. 2
Fig. 2. The IgG3 hinge provides broad Fc spatial mobility spectra and flexibility relative to M protein.
A The average distance between the center of mass of the M1 protein and the Fc domain of the IgG, IgG3, and IgGh62 was measured over the three replicates of each system (reported in pink and cyan, respectively). The shades correspond to standard deviations, and the initial distances are shown with dashed lines. B The center of mass of the Fc domain of IgG1 (in blue), IgG3 (in red), and IgGh62 (green) are depicted at every snapshot of the simulations. The intensity of the colors represents the population of each point. The center of mass of M1 is shown with a gray circle at the origin. The individual distribution of points are reported for C IgG1-M1, D IgG3-M1, and E IgGh62-M1 simulations. F The angle changes formed between the Fc domain and protein M1 are reported for IgG1 (in pink), IgG3 (in cyan), and IgGh62 (green) when both Fabs contact the protein M1. The average values are shown with lines. The vectors forming each angle are depicted in the inset. G The most representative conformation of the M1-IgG3 is reported when dual-Fab binding was observed. The IgG-M1 models in the figure are the starting models for the MD simulation. Source data are provided as a Source Data file.
Fig. 3
Fig. 3. The constant domain influences the interaction network between the IgG Fabs and M1 at an atomic level in silico.
The interaction network at the interface of Fab domain and protein M1. The frequency of A Hbonds and B salt bridges formed in every replicate of the IgG1-M1 and IgG3-M1 simulations is reported in red and blue shades, respectively. The interactions are also shown on the structure of C IgG1-M1, D IgG3-M1, and E IgGh62-M1 with black lines for both Hbonds and Salt-bridges. The residues involved in the interactions are shown as spheres. The two chains of protein M1 are colored in light and dark purple, and the VH (variable heavy), CH1 (constant heavy domain 1), VL (variable light), and CL (constant domain light chain) domains are shown in light green, dark green, pink, and red, respectively. The IgG-M1 models in the figure are the starting models for the MD simulations. Source data are provided as a Source Data file.
Fig. 4
Fig. 4. Systemic characterization of IgG3 hinge reveals that hinge length influences Fc-mediated function.
A Schematic illustration of hinge-modified variants with Ab25 variable domains, IgG1 backbone but different segments of IgG3 hinge (17, 32, 47 or 62 amino acids). B IgG binding to live SF370 bacteria at different concentrations. C % of phagocytes associating (FITC + ) with bacteria at different MOP’s, while D shows the same but with % internalized and E shows the normalized bacterial signal and F shows the phagocytosis score. In CF IgG1, IgGh 17, 32, and, 47 hinge variants are assessed. G Shows the phagocytosis score at different MOP’s for the 62 hinge-variant, 47-variant and IgG1. In B-F 15 ug/mL of mAbs was used. The mean is shown in all panels, and the error bars are SEM. The phagocytosis score in EF is normalized to Ab25 IgG1’s phagocytosis score for each individual experiment (N = 4 independent experiments). Data in BG are from N = 4 independent experiments. Experiments in G were done separately from those at B-F. All statistical comparisons were made against the IgGh47 variant. The statistical test was one-way ANOVA with multiple comparisons corrected by Dunnett’s post hoc test. **** denotes P-value < 0.0001, *** denotes P-value < 0.001, ** denotes P-value < 0.01, * denotes P-value < 0.05 and P-value > 0.05 is ns. Source data are provided as a Source Data file.
Fig. 5
Fig. 5. IgGh47 subclass retains the high affinity of IgG1 and gains the high opsonic function of IgG3.
A Schematic of IgG1, IgG3, and the IgGh47. The constant domains of the heavy chains are depicted in different colors: blue for IgG1 and red for IgG3. B MOP50 curves of the subclasses, bacteria were opsonized with 15 ug/mL of IgG. The Y-axis shows the percentage of bacteria+ THP-1 cells, while the X-axis depicts the ratio of bacteria to phagocytes added (MOP). The MOP50 values with a 95% CI are shown in each graph, and fold differences over IgG1 (non-overlapping 95% CI) to show statistical significance. The data points are from N = 3 independent experiments. C Shows the MOP50 curves of all the antibody treatments in one graph, control is IgG1-isotype. C Individual MOP50 values from N = 3 independent experiments. D Percentage of THP-1 cells with internalized bacteria across the MOP range. E Amount of bacteria that are phagocytosed by the whole THP-1 cell population measured as median MFI of FITC-A (bacterial signal, Oregon Green). F, G Phagocytosis score for each antibody treatment is shown with MOP on the X-axis for F, while in G, the MOP is 200 except for internalization when the MOP is 100. H-I shows Ex vivo phagocytosis with neutrophils and monocytes at MOP 25. The graphs depict %association (normalized to Ab25 IgG1), % internalization, bacterial signal (normalized to Ab25 IgG1) and phagocytosis score (normalized to Ab25 IgG1). For CG, statistical analysis was done by comparing the treatments to IgG1 with one-way ANOVA multiple comparisons corrected by Dunnett’s post hoc correction test. For H and I, repeated measures one-way ANOVA was used and compared against IgGh47. *** denotes P-value < 0.001, ** denotes P-value < 0.01, * denotes P-value < 0.05 and P-value > 0.05 is ns.* denotes P-value < 0.05 and P-value > 0.05 is ns. The data points in (B)–(I) represent the mean value, and the error bars are in SEM. In (D)–(G), N = 5 independent experiments were performed, while in (H)–(I), data was acquired from N = 6 independent experiments and unique donors (N = 6). Source data are provided as a Source Data file.
Fig. 6
Fig. 6. IgGh47 confers protection against systemic infection in mice.
A Schematic of the animal experiment: pre-treatment 0.4 mg of antibody treatment or PBS 6 hours before infection with AP1, made using Biorender. Animals were sacrificed 24 hours post-infection, and organs and blood were harvested for analysis. B Shows pooled data from two independent experiments of 5 mice in each cohort (total n = 10 mice). Bacterial load (CFU/g) in each organ was determined by serial dilution and viable count determination after overnight incubation (undetectable bacteria was labeled as 14 CFU/g). C shows the percentage of mice positive for bacteria in each respective organ for all treatments with statistical significant differences (or non-significance) compared with IgGh47 seen above each treatment from test in (E). D Cytokine levels (pg/ mL) in plasma were measured using a cytometric bead array at two different occasions analyzing 5 mice/condition at time (N = 10). E Kaplan-Meier curves are depicted in E for PBS vs. IgGh47, IgGh47 vs. IgG3, and IgGh47 vs. IgG1 comparisons. The Y-axis shows the probability of bacterial dissemination (adverse outcome) with log-rank (Mantel-Cox) tests used to determine statistical significance, which are also shown for the PBS comparison in the table in (C). FH Ab25-derived peptides identified in the plasma of antibody-treated mice challenged with GAS. Plasma was collected at 24 h postinfection (n = 5 animals/condition; treatments corresponded to Ab25 with an IgG1, IgG3, or IgGh47 and the peptides were identified by Protein G pulldowns, trypsin digestion and mass spectrometric analysis. Log2 intensity of peptides derived from F the heavy chain, G light chain and H hinge regions of the monoclonal antibodies. In B and D, the median is shown. Statistical analysis was performed, comparing the treatments to the IgGh47 in B, by Kruskal-Wallis with multiple comparisons and Dunn’s correction test. ** denotes P-value < 0.01, * denotes P < 0.05 and P-value > 0.05 is ns across the figure. In E, log-rank (Mantel-Cox) test was performed, in FH one-way ANOVA was done with Dunnett’s post hoc test to correct for multiple comparisons. Source data are provided as a Source Data file.
Fig. 7
Fig. 7. IgGh47 potent opsonic phenotype is generalizable to other emm types.
A Percentage of similarity of different emm types to emm1 covering Ab25’s epitope. B Percentage identity matrix of all the emm types used for the sequence covering Ab25’s dual-span epitope. C Table summarizing the mean value of phagocytosis score for each mAb for the different emm types. D Percentage of THP1- cells with internalized bacteria across the different treatments for different emm types. E Bacterial signal detected for the whole THP1 cell population for the different emm types. The F Phagocytosis score (mean value sumarized in C) for the treatments across the emm types. For all emm types, MOP 50 was used in the experiments, except for emm179 (MOP 25) and emm4 (MOP 100). Statistical comparison was done by comparing all treatments to Ab25 IgGh47 with one-way ANOVA with multiple comparisons and post hoc Dunnett’s test to correct for multiple comparisons. **** denotes P-value < 0.0001, *** denotes P-value < 0.001, ** denotes P-value < 0.01 * denotes P < 0.05 and P-value > 0.05 is ns. The mean is shown and the error bars are SEM throughout the figure. In DF, for emm4 and emm179, N = 4 independent experiments were performed, while for emm12, 28, 79, and 81, N = 5 independent experiments were performed. Source data are provided as a Source Data file.
Fig. 8
Fig. 8. SARS-CoV-2 mAbs engineered from IgG1 to IgGh47 subclass exhibit a potent opsonic function.
A Illustration depicting a SARS-CoV-2 virion with the spike protein trimer antigen and the three different clones Ab11, Ab36 and Ab77 which were made into IgGh47 from an original IgG1. Schematic made using Biorender. B MOP curves with MOP50 and 95% CI are in brackets for the different mAbs, with statistically significant differences (non-overlapping 95%CI) between the two mAbs are highlighted (*). C Phagocytosis score across the different MOPs. D, E Depicts association and phagocytosis score at MOP 30. Statistical comparison was made by comparing the IgG1 with that of IgGh47 version with Mann-Whitney U two-tailed test. Across the figure mean is shown and error bars are SEM.*** denotes P-value < 0.001, ** denotes P-value < 0.01 * denotes P < 0.05 and P-value > 0.05 is ns. Positive control is DuomAb IgG3, and negative control is Xolair IgG1. In B-C N = 3 independent experiments were performed while at D and E N = 4 independent experiments were performed. Source data is provided as a Source Data file.

Similar articles

Cited by

References

    1. Vidarsson G, Dekkers G, Rispens T. IgG subclasses and allotypes: From structure to effector functions. Frontiers in Immunology. 2014;5:1–17. doi: 10.3389/fimmu.2014.00520. - DOI - PMC - PubMed
    1. Roco JA, et al. Class-switch recombination occurs infrequently in germinal centers. Immunity. 2019;51:337–350. doi: 10.1016/j.immuni.2019.07.001. - DOI - PMC - PubMed
    1. Oi VT, et al. Correlation between segmental flexibility and effector function of antibodies. Nature. 1984;307:136–140. doi: 10.1038/307136a0. - DOI - PubMed
    1. Torres M, Casadevall A. The immunoglobulin constant region contributes to affinity and specificity. Trends in Immunology. 2008;29:91–97. doi: 10.1016/j.it.2007.11.004. - DOI - PubMed
    1. Janda A, Bowen A, Greenspan NS, Casadevall A. Ig constant region effects on variable region structure and function. Frontiers in Microbiology. 2016;7:1–10. doi: 10.3389/fmicb.2016.00022. - DOI - PMC - PubMed

Publication types

MeSH terms