. 2024 Apr 27;15(1):3590.
doi: 10.1038/s41467-024-48042-5.

Lifecycle of a predatory bacterium vampirizing its prey through the cell envelope and S-layer

Affiliations

Lifecycle of a predatory bacterium vampirizing its prey through the cell envelope and S-layer

Yoann G Santin et al. Nat Commun. .

Erratum in

Abstract

Predatory bacteria feed upon other bacteria in various environments. Bdellovibrio exovorus is an obligate epibiotic predator that attaches on the prey cell surface, where it grows and proliferates. Although the mechanisms allowing feeding through the prey cell envelope are unknown, it has been proposed that the prey's proteinaceous S-layer may act as a defensive structure against predation. Here, we use time-lapse and cryo-electron microscopy to image the lifecycle of B. exovorus feeding on Caulobacter crescentus. We show that B. exovorus proliferates by non-binary division, primarily generating three daughter cells. Moreover, the predator feeds on C. crescentus regardless of the presence of an S-layer, challenging its assumed protective role against predators. Finally, we show that apparently secure junctions are established between prey and predator outer membranes.


Conflict of interest statement

The authors declare no competing interests.

Figures

Fig. 1
Fig. 1. B. exovorus predation of α-proteobacterial species is not limited to C. crescentus.
a Representative phase contrast images of an overnight mix between the S-layer deficient C. crescentus CB15N ∆rsaA mutant and B. exovorus. C. crescentus ghost cells (blue arrowhead) and high numbers of smaller vibrioid cells (B. exovorus, white arrowhead) are only observed upon mixing with B. exovorus. Scale bar, 2 μm. b Phylogeny of the selected α-proteobacterial species was derived from 16S rRNA sequences (using E. coli as an outgroup). Species susceptible to predation by B. exovorus are designated in blue. The red circle represents the evolutionary event separating Hyphomicrobiales and Caulobacterales. c Representative phase contrast images of overnight mixes between B. exovorus and the selected α-proteobacterial preys or E. coli as a negative control. Positive predation is evidenced by the presence of ghost cells (blue arrowheads) and the proliferation of B. exovorus predators (white arrowheads). Scale bar, 2 μm.
Fig. 2
Fig. 2. The S-layer does not prevent B. exovorus predation.
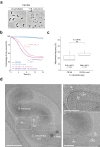
a Representative phase contrast images of an overnight co-culture between the wild-type C. crescentus CB15N and B. exovorus. C. crescentus ghost cells (blue arrowhead) and newborn B. exovorus predators (white arrowhead) are shown. Scale bar, 2 μm. b Similar antibacterial efficiency of the B. exovorus predator was measured when the wild-type or the ∆rsaA C. crescentus strains are used as a prey. C. crescentus prey cells were co-incubated with B. exovorus in a microplate for 16 h at 30 °C. Optical density at 660 nm (here represented as the percentage of the initial population) was monitored over time, and metrics were extracted using CuRveR. rmax corresponds to the killing rate, and s is the time point at which rmax reaches its maximum value. Colored lines correspond to the fit, and dots are values obtained from three technical replicates. The assay was performed four times, and a representative result is shown. c Boxplot representation of the frequency of attachment events of B. exovorus onto the wild-type or ∆rsaA C. crescentus strains 15 min after flowing the B. exovorus cells into the microfluidics chamber. Values correspond to the fraction of prey cells in contact with a predator cell. Bold horizontal bars represent the median value; empty circles represent the mean; the lower and upper boundaries of the internal box plot correspond to the 25th and 75th percentiles, respectively; the whiskers represent the 10th and 90th percentiles. Mean values ± standard deviation and the number of analyzed cells (n) are indicated below. Pairwise comparison and the value of the mean difference and the standard deviation from three biological replicates are indicated above the plot (ns nonsignificant, p = 0.4; two-sided two-sample Fisher–Pitman permutation test). Source data are provided as a Source Data file. d Representative cryo-EM images of B. exovorus attached to the wild-type (WT) C. crescentus CB15N cell surface (left). Scale bar, 0.5 μm. Magnifications of the selected regions representing the prey envelope layers (top right), and the tight contact between the predator and the prey outer layers (bottom right). PHB polyhydroxybutyrate granule, SL S-layer, OM outer membrane, IM inner membrane. The experiment was repeated twice with similar results. Scale bar, 0.2 μm.
Fig. 3
Fig. 3. B. exovorus displays a novel division pattern regardless of prey size.
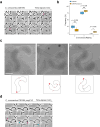
B. exovorus mainly produces triplet progenies. a Representative time-lapse phase contrast microscopy images of B. exovorus growing onto the wild-type C. crescentus prey. The white arrowhead indicates the attachment of a B. exovorus cell to a C. crescentus cell. Magenta arrowheads show the production of three progenies. Scale bar, 2 μm. b Boxplot representation of the frequency of 2, 3, or 4 B. exovorus progenies using either the wild-type (blue; n = 413) or popZ::Ω (orange; n = 201) C. crescentus strains as prey. Quantification based on Fig. 3a, d. Bold horizontal bars represent the median value; empty circles represent the mean; the lower and upper boundaries of the internal box plot correspond to the 25th and 75th percentiles, respectively; the whiskers represent the 10th and 90th percentiles. Pairwise comparisons from three biological replicates are indicated above the plots (ns nonsignificant; *p <  0.05, two-sided Wilcoxon’s t-test). Source data are provided as a Source Data file. c Representative cryo-EM images of B. exovorus growing onto the wild-type C. crescentus prey. Each image corresponds to one late step of the B. exovorus growth, including the formation of the first constriction site at the distal end of the filament (i), the formation of the second constriction site (ii), and the sequential progenies release (iii). Scale bar, 0.5 μm. The experiment was repeated twice with similar results. Hand-drawn schematic representations based on the cryo-EM image are shown below. Red star corresponds to the predator–prey contact site. Red and black arrows indicate B. exovorus constriction and division sites, respectively. d Representative time-lapse phase contrast microscopy of B. exovorus growing onto the C. crescentus popZ::Ω mutant strain as a prey. Cyan and magenta arrowheads show the production of 2 or 3 progenies, respectively. Scale bar, 2 μm.
Fig. 4
Fig. 4. B. exovorus digests prey content in situ through unaltered external envelope layers.
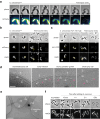
a The mCherry fluorescent signal is used as a reporter of the proteinaceous cytoplasmic content. Representative time-lapse microscopy images of the mCherry-producing C. crescentus (C. crescentusmCh) predated by B. exovorus. The number of future predator daughter cells is indicated on the phase contrast images. The fluorescence signal was false colored with the GreenFireBlue colormap in Fiji to display changes in fluorescence intensity. The white arrowhead points at the B. exovorus attached to the prey surface. The predated C. crescentus cell outlines shown as dashed lines were drawn manually based on the phase contrast image at time 0. Scale bar, 2 μm. b, c Time-course imaging of the C. crescentusmCh (b) or the C. crescentus HU1::HU1-yfp (c) strain predated by B. exovorus. Predator cells were mixed with preys and stained with DAPI 10 min prior imaging at each selected time point. Top: phase contrast, middle: mCherry (b) or HU1-YFP (c) signal, and bottom: DAPI fluorescence images of selected time points from a representative experiment are shown. Cell outlines for B. exovorus (yellow) and C. crescentus (dashed white) were drawn manually based on phase contrast images. Scale bar, 2 μm. d Representatives cryo-EM images of the C. crescentus CB15N envelope layers and cytoplasm during B. exovorus predation. Partial or total disruptions (magenta arrowheads) of the prey’s inner membrane are observed through the predatory cell cycle. SL S-layer, OM outer membrane, IM inner membrane. Scale bar, 0.1 μm. e Representative cryo-EM image of an entire C. crescentus ghost cell. The integrity of the outer layers (S-layer and outer membrane) is conserved, maintaining the original cell shape. PHB polyhydroxybutyrate granule, SL S-layer, OM outer membrane, IM inner membrane. Scale bar, 0.5 μm. d, e Experiments were repeated twice with similar results. f Phase contrast (top) and fluorescence (bottom) images of wild-type C. crescentus labeled with the fluorescent d-amino acid HADA for 3 h, at the indicated time points before or upon addition of B. exovorus. Brightness and contrast are adjusted individually for each time point for display purposes. Predated and ghost C. crescentus cells retain HADA labeling all around the cells. Scale bar, 2 µm.
Fig. 5
Fig. 5. Predator feeding occurs through a fixed-size junction clamping prey and predator outer membranes.
a Representative cryo-EM image of B. exovorus attached to the wild-type C. crescentus cell surface. The dashed double-arrow highlights the fixed-size junction between the predator and prey outer membranes. This image was previously used in Fig. 4d to show the early prey inner membrane disruption (Early infection). No S-layer structure is visible on the predator surface. A magnified view of the contact site is displayed in the top-right corner, accompanied by a hand-drawn schematic representation based on the cryo-EM image. Green arrows represent the export of B. exovorus molecules in the prey and the import of prey content during feeding. SL S-layer (pink), OM outer membrane (blue), dIM, disrupted inner membrane (green). Other examples are shown in b. Scale bar, 0.2 μm. c Boxplot representation of the size of the predator–prey junction with the wild-type or the ∆rsaA C. crescentus strain as a prey. Bold horizontal bars represent the median value; empty circles represent the mean; the lower and upper boundaries of the internal box plot correspond to the 25th and 75th percentiles, respectively; the whiskers represent the 10th and 90th percentiles. Values of the mean, the standard deviation, and the number of analyzed cells (n) are indicated. A pairwise comparison from two biological replicates is indicated above the plot (ns nonsignificant; two-sample Fisher–Pitman permutation test). Source data are provided as a Source Data file.
Fig. 6
Fig. 6. Model of the B. exovorus life cycle.
Numbers indicate key steps in the cycle: (1) B. exovorus predator initially hunts for its prey. (2) Once tightly attached to the prey cell surface, the predator forms a specific junction at the feeding pole (opposite to the flagellated pole), pulling the prey’s outer layers (S-layer in pink and outer membrane in dark gray) towards its outer membrane. (3) The secretion of specific enzymes enables the in situ digestion of prey contents. Degraded prey molecules are then imported, promoting predator elongation. (4) As the predator grows, constriction sites sequentially emerge along the filament. At the end of the filament growth, cell division sequentially releases the outermost (5) and then the second progeny within minutes (6). (7) Finally, the last predator cell detaches from the prey surface, leaving a ghost cell devoid of its cellular contents but maintaining its shape. The escape of the mother cell leaves an open scar that is not resealed by B. exovorus.

References

    1. Pérez, J., Moraleda‐Muñoz, A., Marcos‐Torres, F. J. & Muñoz‐Dorado, J. Bacterial predation. Environ. Microbiol.18, 766–779 (2016). - PubMed
    1. Seef, S. et al. A Tad-like apparatus is required for contact-dependent prey killing in predatory social bacteria. eLife10.7554/elife.72409 (2021). - PMC - PubMed
    1. Rombouts, S. et al. Multi-scale dynamic imaging reveals that cooperative motility behaviors promote efficient predation in bacteria. Nat. Commun.14, 5588 (2023). - PMC - PubMed
    1. Sockett, R. E. Predatory lifestyle of Bdellovibrio bacteriovorus. Annu. Rev. Microbiol.63, 523–539 (2009). - PubMed
    1. Laloux, G. Shedding light on the cell biology of the predatory bacterium Bdellovibrio bacteriovorus. Front. Microbiol.10, 3136 (2020). - PMC - PubMed

Publication types

MeSH terms