. 2024 Apr 27;15(1):3587.
doi: 10.1038/s41467-024-48002-z.

Three-dimensional domain identification in a single hexagonal manganite nanocrystal

Affiliations

Three-dimensional domain identification in a single hexagonal manganite nanocrystal

Ahmed H Mokhtar et al. Nat Commun. .

Abstract

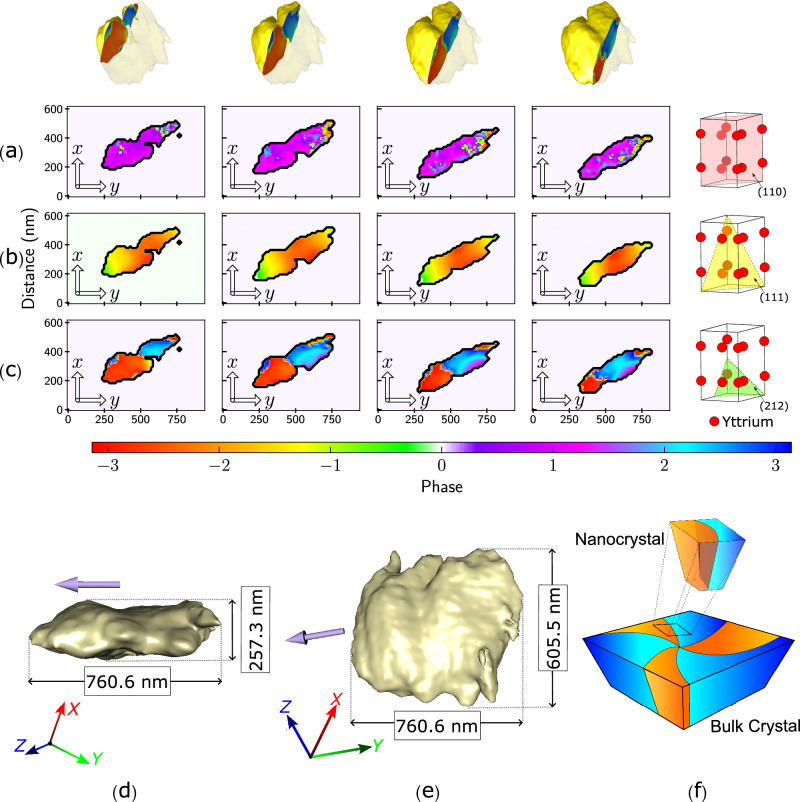
The three-dimensional domain structure of ferroelectric materials significantly influences their properties. The ferroelectric domain structure of improper multiferroics, such as YMnO3, is driven by a non-ferroelectric order parameter, leading to unique hexagonal vortex patterns and topologically protected domain walls. Characterizing the three-dimensional structure of these domains and domain walls has been elusive, however, due to a lack of suitable imaging techniques. Here, we present a multi-peak Bragg coherent x-ray diffraction imaging determination of the domain structure in single YMnO3 nanocrystals. We resolve two ferroelectric domains separated by a domain wall and confirm that the primary atomic displacements occur along the crystallographic c-axis. Correlation with atomistic simulations confirms the Mexican hat symmetry model of domain formation, identifying two domains with opposite ferroelectric polarization and adjacent trimerization, manifesting in a clockwise arrangement around the hat's brim.


Conflict of interest statement

The authors declare no competing interests.

Figures

Fig. 1
Fig. 1. Material structure characteristics.
a, b Side-view of the paraelectric and ferroelectric unit cells, respectively. Yttrium (Y) ions are red, Oxygen (O) ions are orange, and Manganese (Mn) ions are  cyan. The green arrows on the Y ions indicate the direction of displacements from the centrosymmetric phase. c Illustration of the six structural domains in YMnO3 viewed down the c-axis, with the arrows indicating the displacements of the apical Oxygen ions corresponding to the tilting of the MnO5 polyhedra. d Potential energy surface of the YMnO3 structural phase transition in YMnO3. The centrosymmetric paraelectric state’s energy is at the hat’s peak. The six equivalent ferroelectric structures of (c) correspond to the six minima in the potential, with trimerisation angle ϕ going around the hat. Crystal structure visualizations presented in ac are prepared using the VESTA software.
Fig. 2
Fig. 2. Schematic layout of the experiment.
An illustration of the experimental geometry in a multi-Bragg Coherent X-Ray Diffraction Imaging (BCDI) experiment. The three detector positions show real data taken in this experiment, from left to right: the (212), (111) and (110) diffraction data.
Fig. 3
Fig. 3. The reconstructed amplitude and phase.
2D slices of the three reconstructed phase maps: a the (111), b (110) and c (212) reflections. The slices of the different phase maps are taken at the same angle (perpendicular to the z-axis) and the same locations in the crystal. The 3D rendering of the crystal on the top row indicates the position at which the slices are taken. The last column illustrates the different planes for each reflection and displays the Yttrium ions' positions in the unit cell. d, e 3D renderings of the reconstructed crystal were taken from two different viewpoints displaying 70% of the amplitude. The (212) Q-vector displayed in purple. f An illustration of how the two observed domains form part of the six intersecting domains in the bulk crystal.
Fig. 4
Fig. 4. The reconstructed full strain tensor.
The reconstructed strain tensor of the crystal, computed as described in the text. The six columns represent each of the six independent components of the strain tensor. Each row is a cross-sectional plane in the crystal taken at the a first, b second and c third locations of the four cross-sectional planes in Fig. 3.
Fig. 5
Fig. 5. Atomistic simulation of the domain structures.
a A plot of the scan through the simulated crystal showing the phase value of the different domains. c A plot of the calculated circular variance between the phase of neighboring domains for the simulated (colored solid lines) and experimental (colored dotted line). The black vertical dotted lines separate the different regions, as indicated in the figure. A match between the simulated and experimental values for the (212) reflection at the β+ and γ− region conclude the type of domains observed experimentally. b Illustrations of the ions' movements in the ferroelectric unit cell relative to their positions in the paraelectric phase for the Yttrium ions. d The clockwise arrow indicates an anti-vortex structure, as is the case for the observed crystal.

Similar articles

Cited by

References

    1. Rabe, K., Ahn, C. & Triscone, J. Physics of Ferroelectrics (Springer Berlin, Heidelberg, 2007).
    1. Meier, D., Seidel, J., Gregg, M. & Ramesh, R. Domain Walls: From Fundamental Properties to Nanotechnology Concepts (Oxford University Press, 2000).
    1. Aken B, Palstra T, Filippetti A, Spaldin N. The origin of ferroelectricity in magnetoelectric YMnO3. Nat. Mater. 2004;3:164–170. doi: 10.1038/nmat1080. - DOI - PubMed
    1. Fennie C, Rabe K. Ferroelectric transition in YMnO3 from first principles. Phys. Rev. B. 2005;72:100103. doi: 10.1103/PhysRevB.72.100103. - DOI
    1. Chae S, et al. Self-organization, condensation, and annihilation of topological vortices and antivortices in a multiferroic. Proc. R. Soc. A. 2010;107:21366–21370. - PMC - PubMed