

Cell-type and sex-specific rhythmic gene expression in the nucleus accumbens
- PMID: 38678086
- PMCID: PMC11449664
- DOI: 10.1038/s41380-024-02569-7
Cell-type and sex-specific rhythmic gene expression in the nucleus accumbens
Abstract
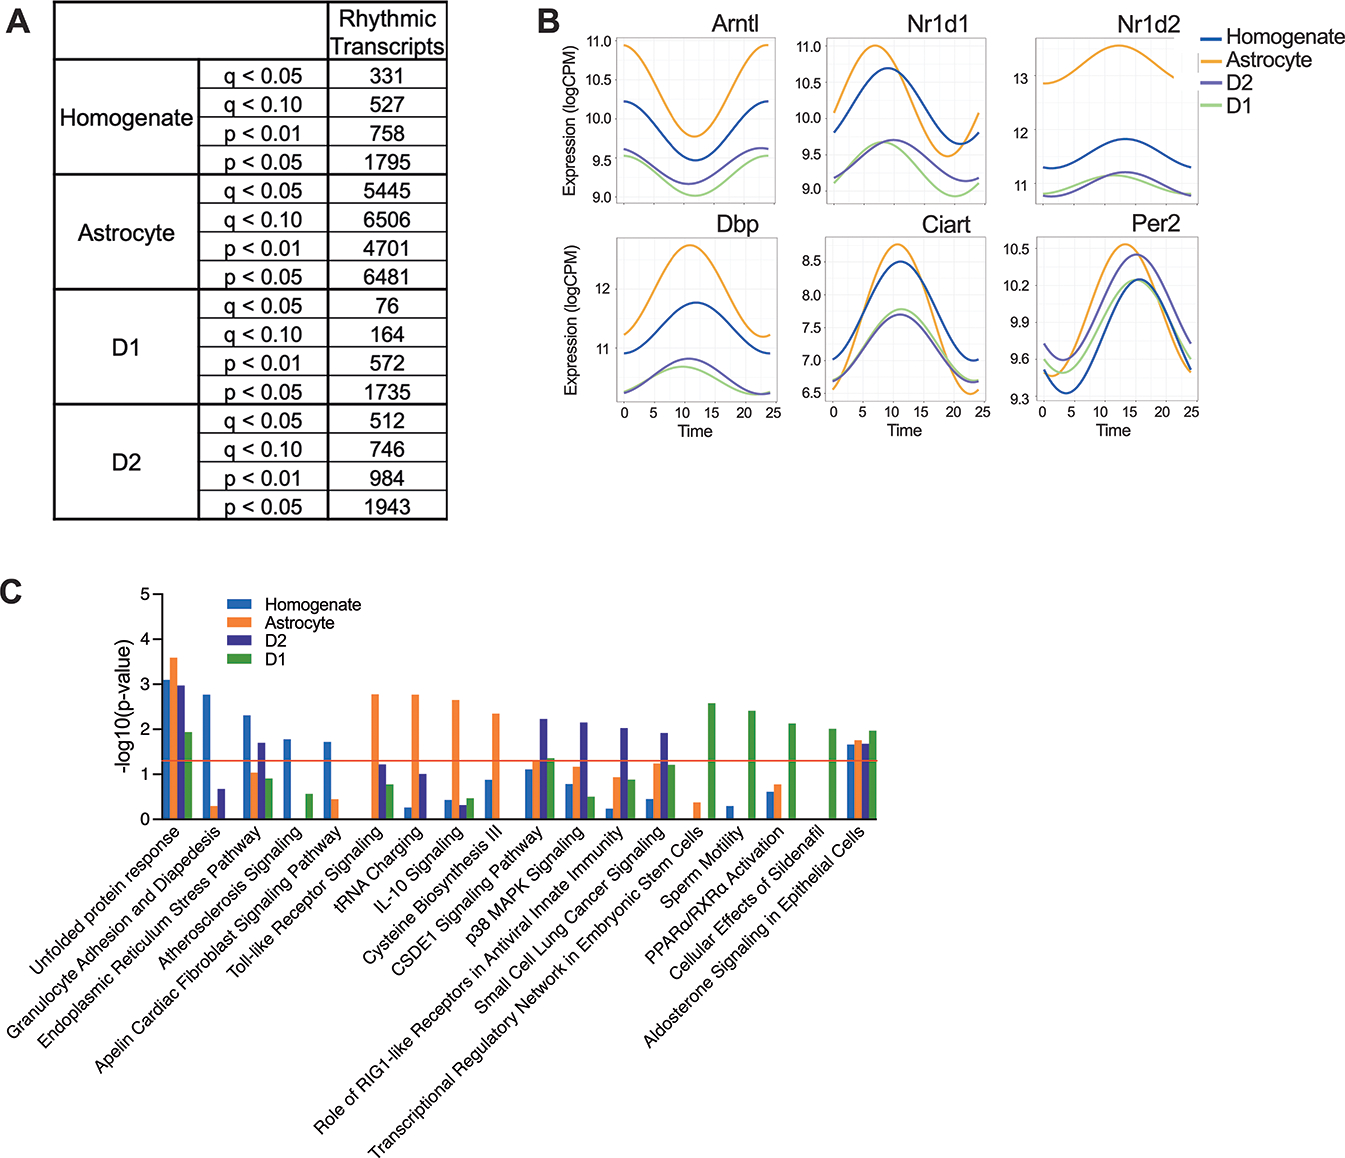
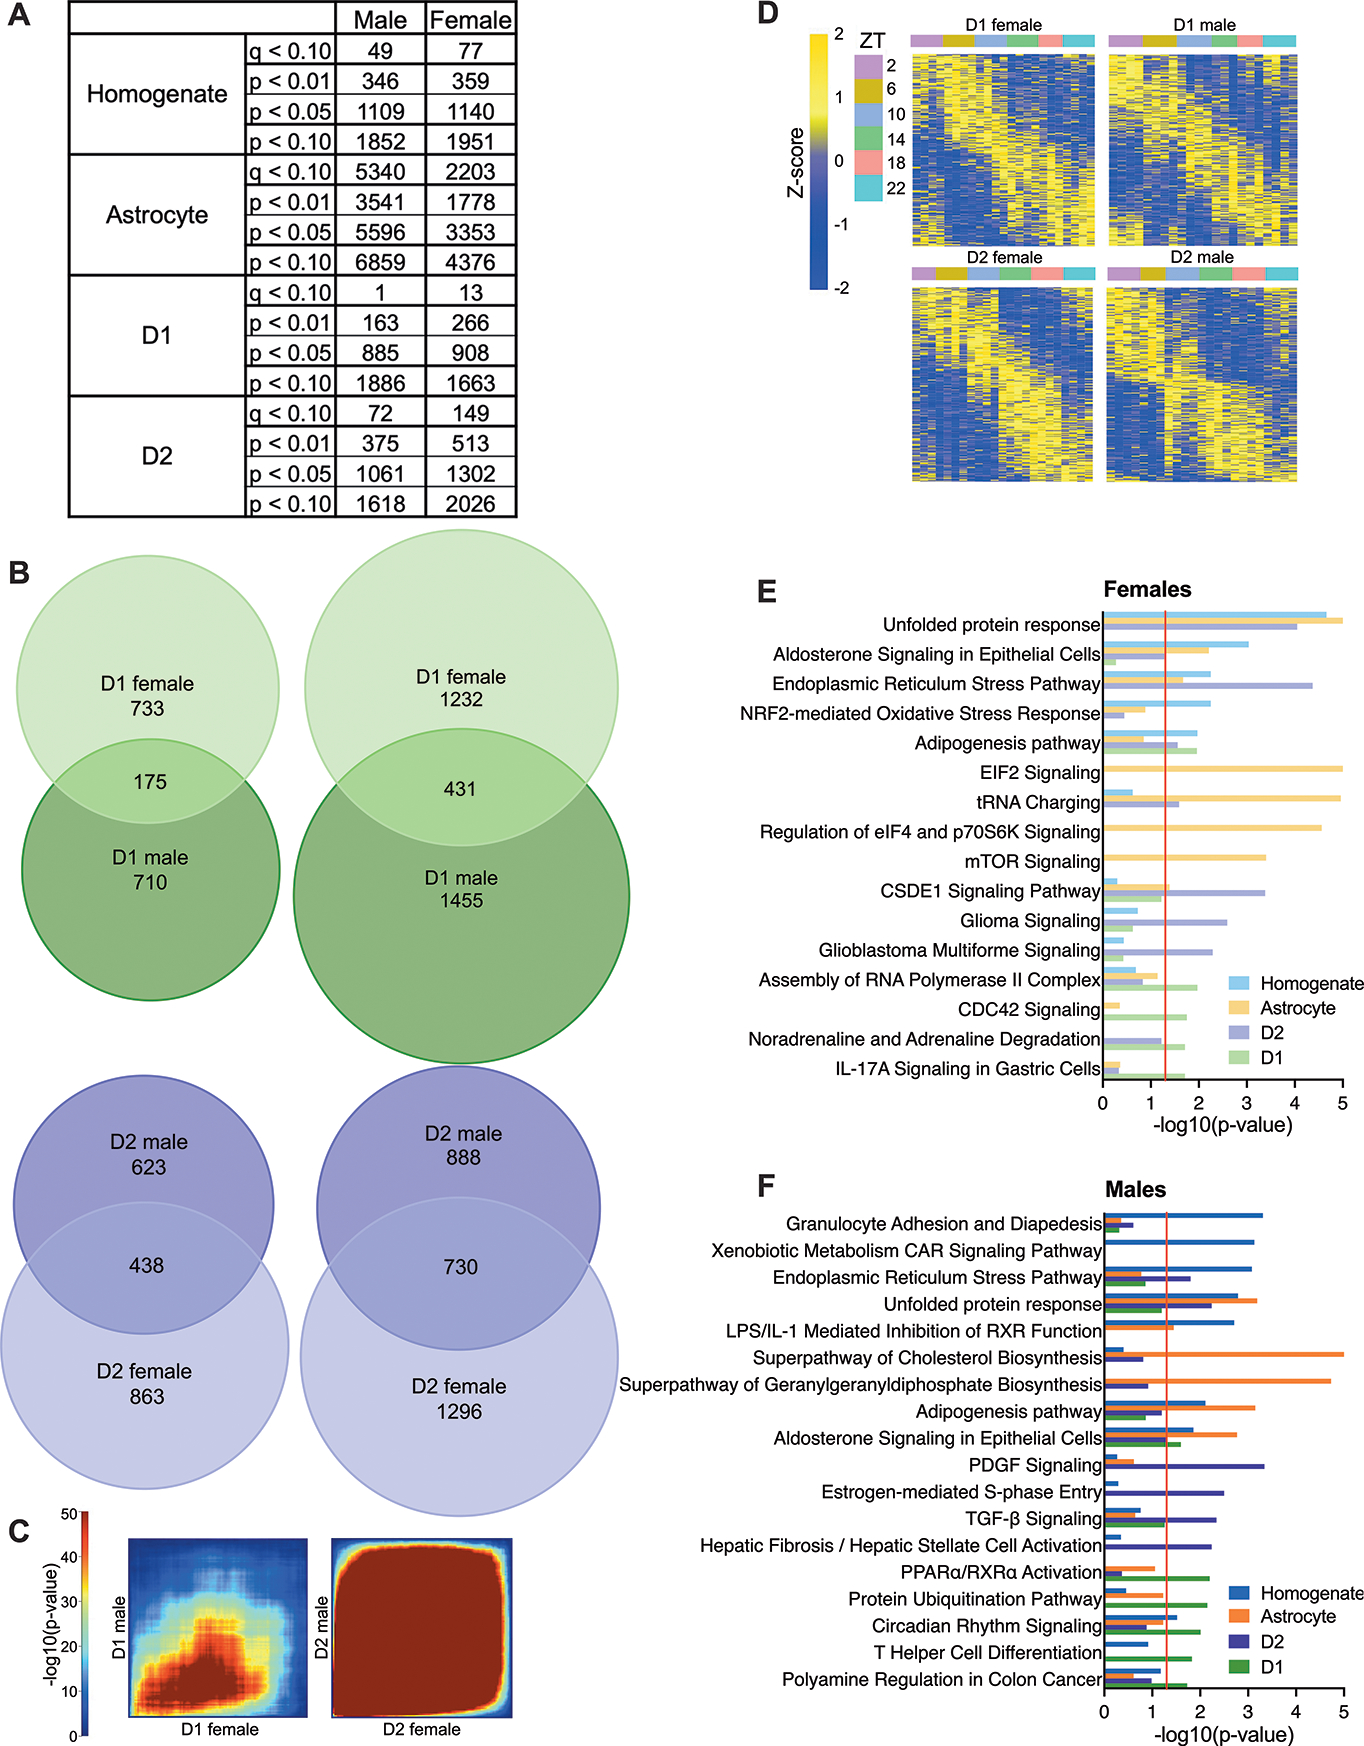
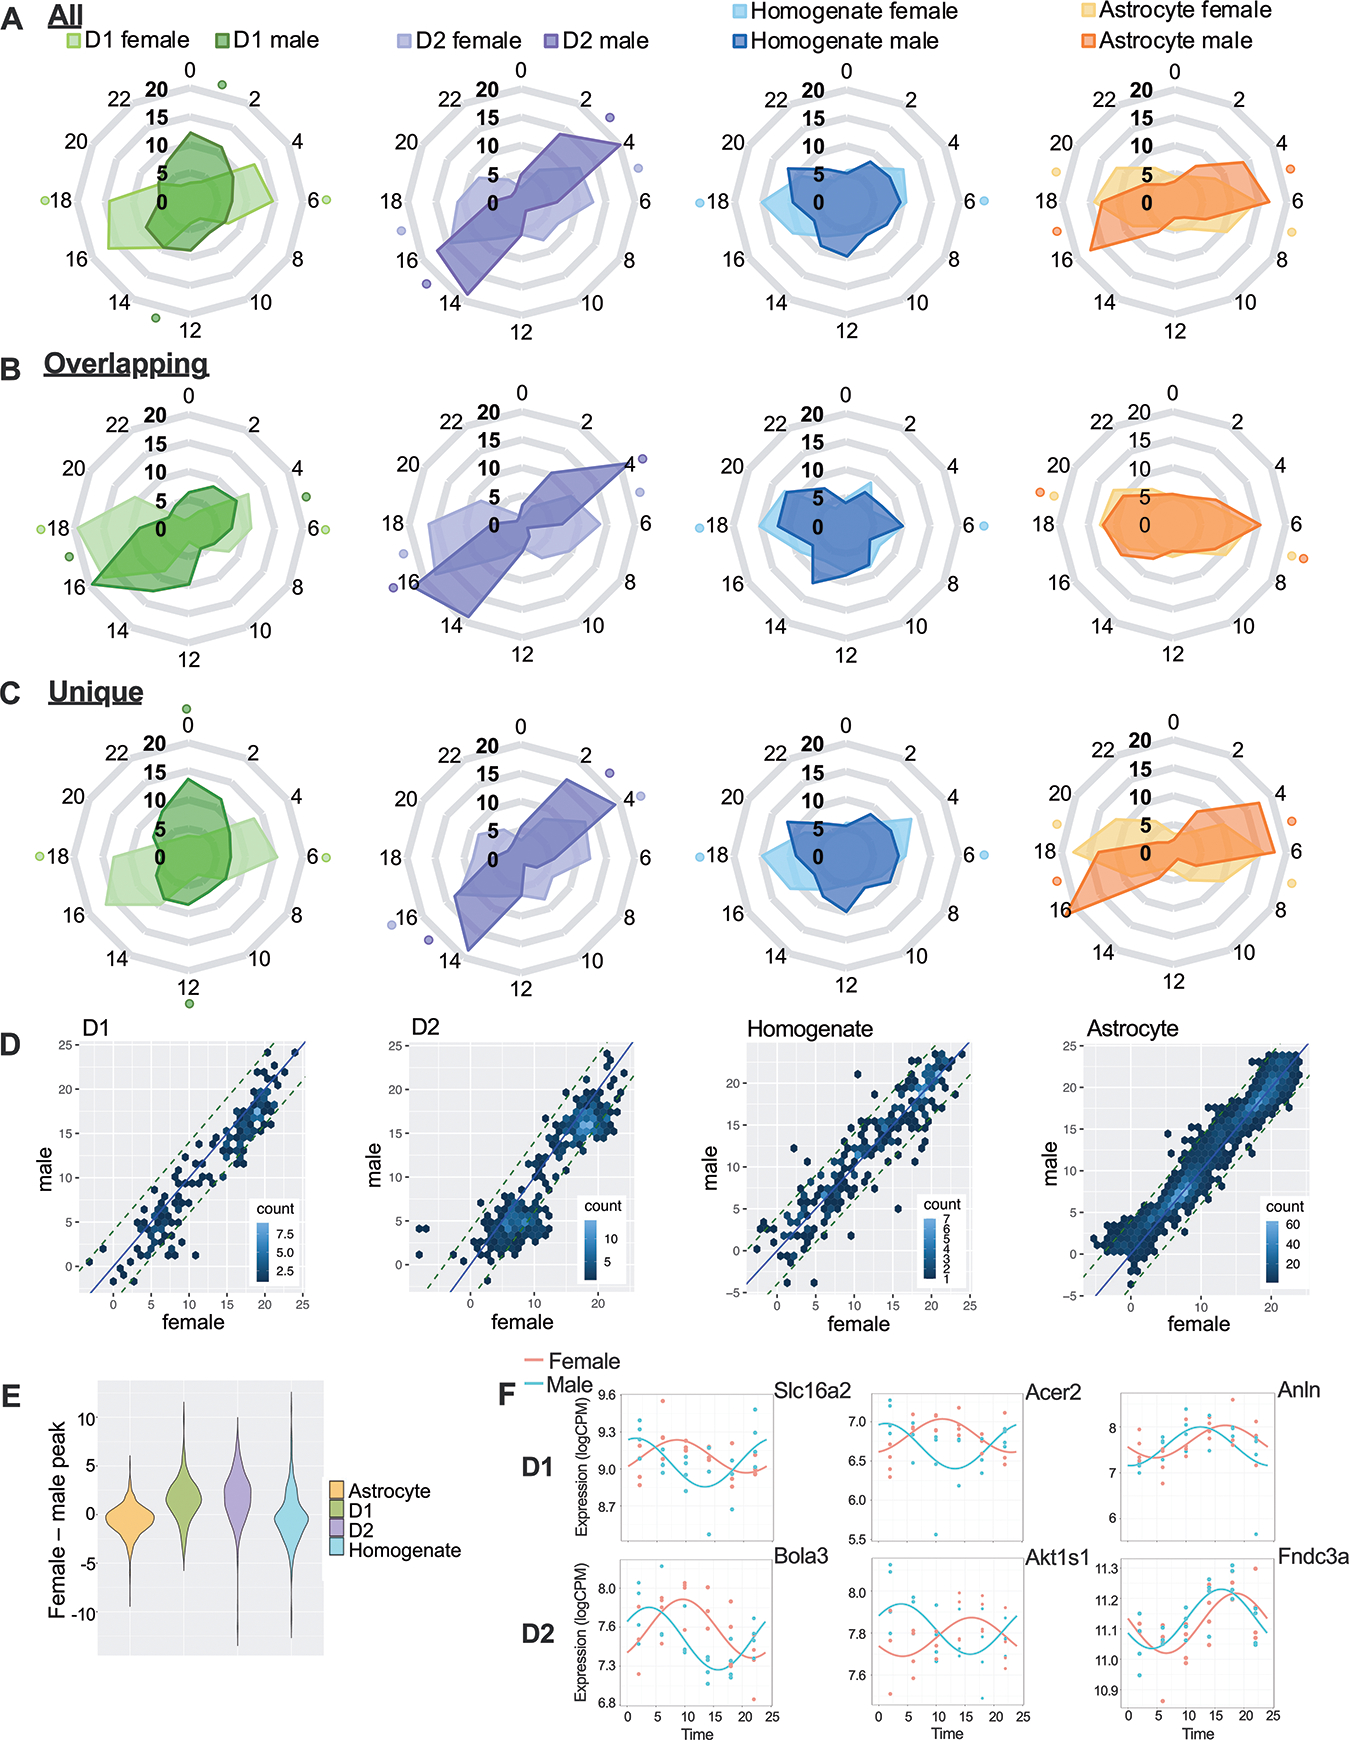
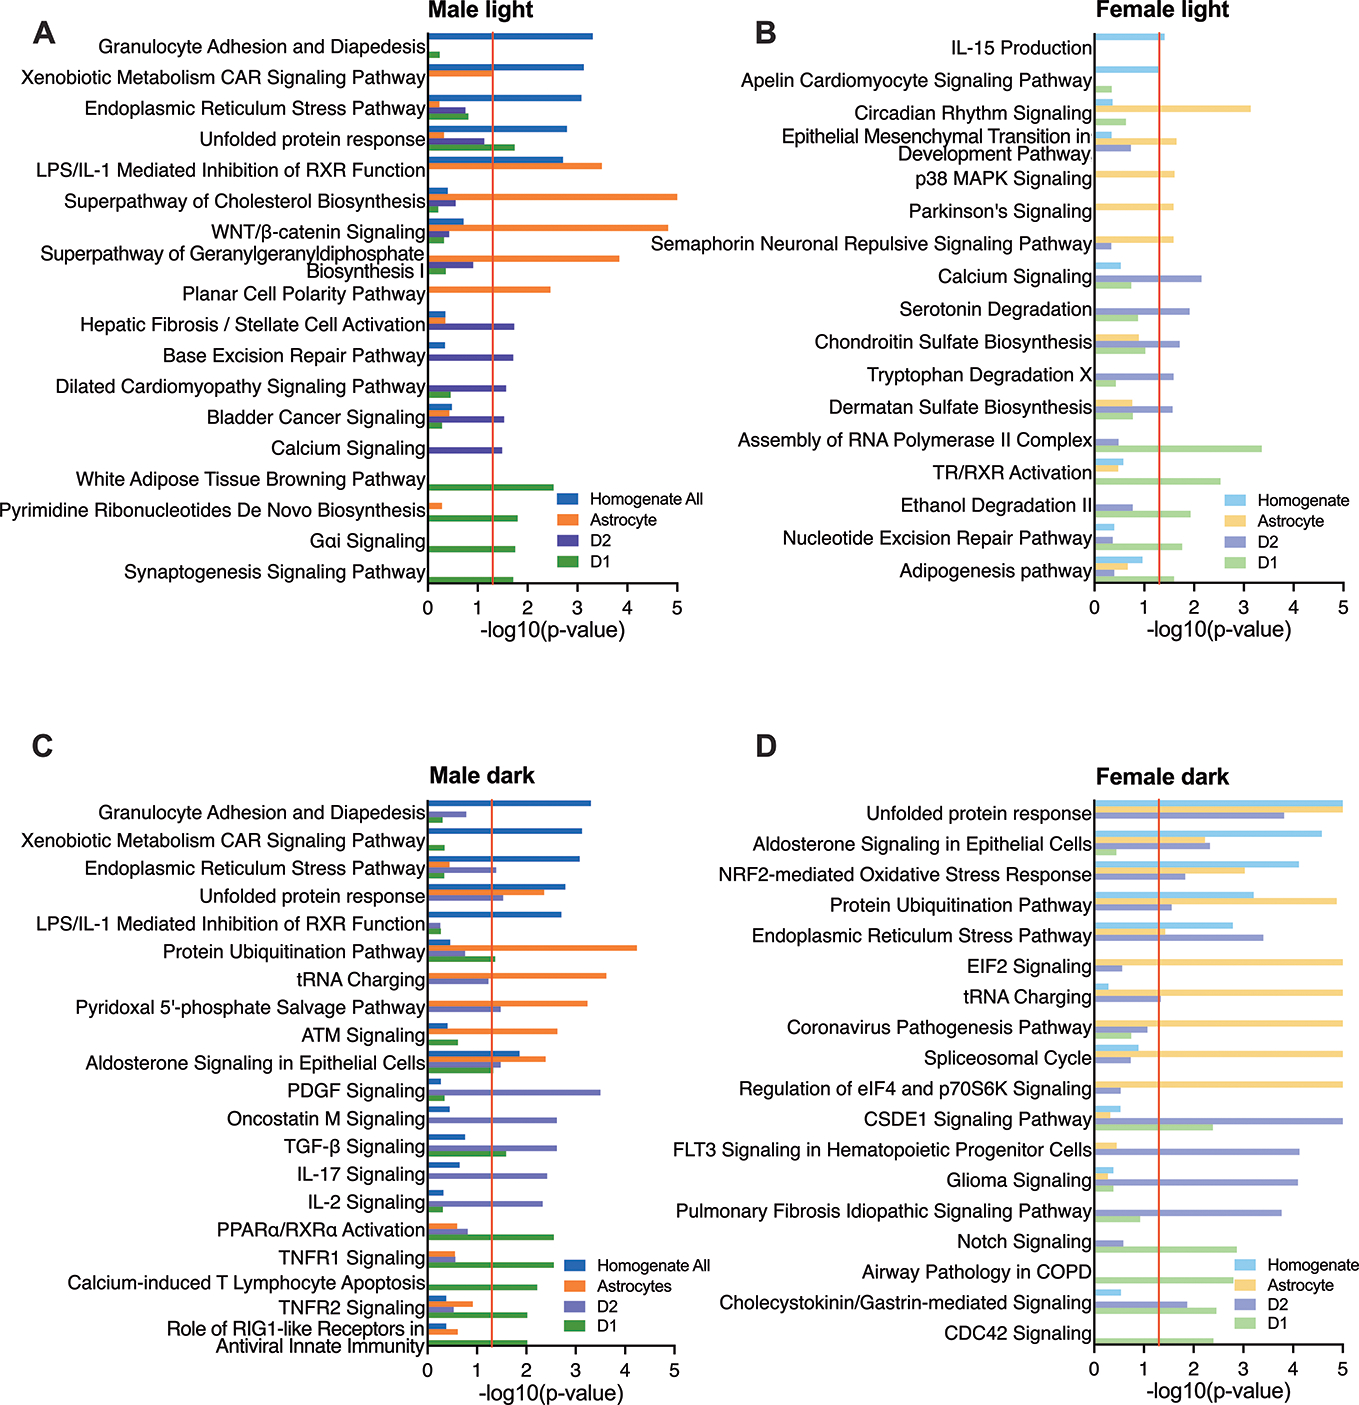
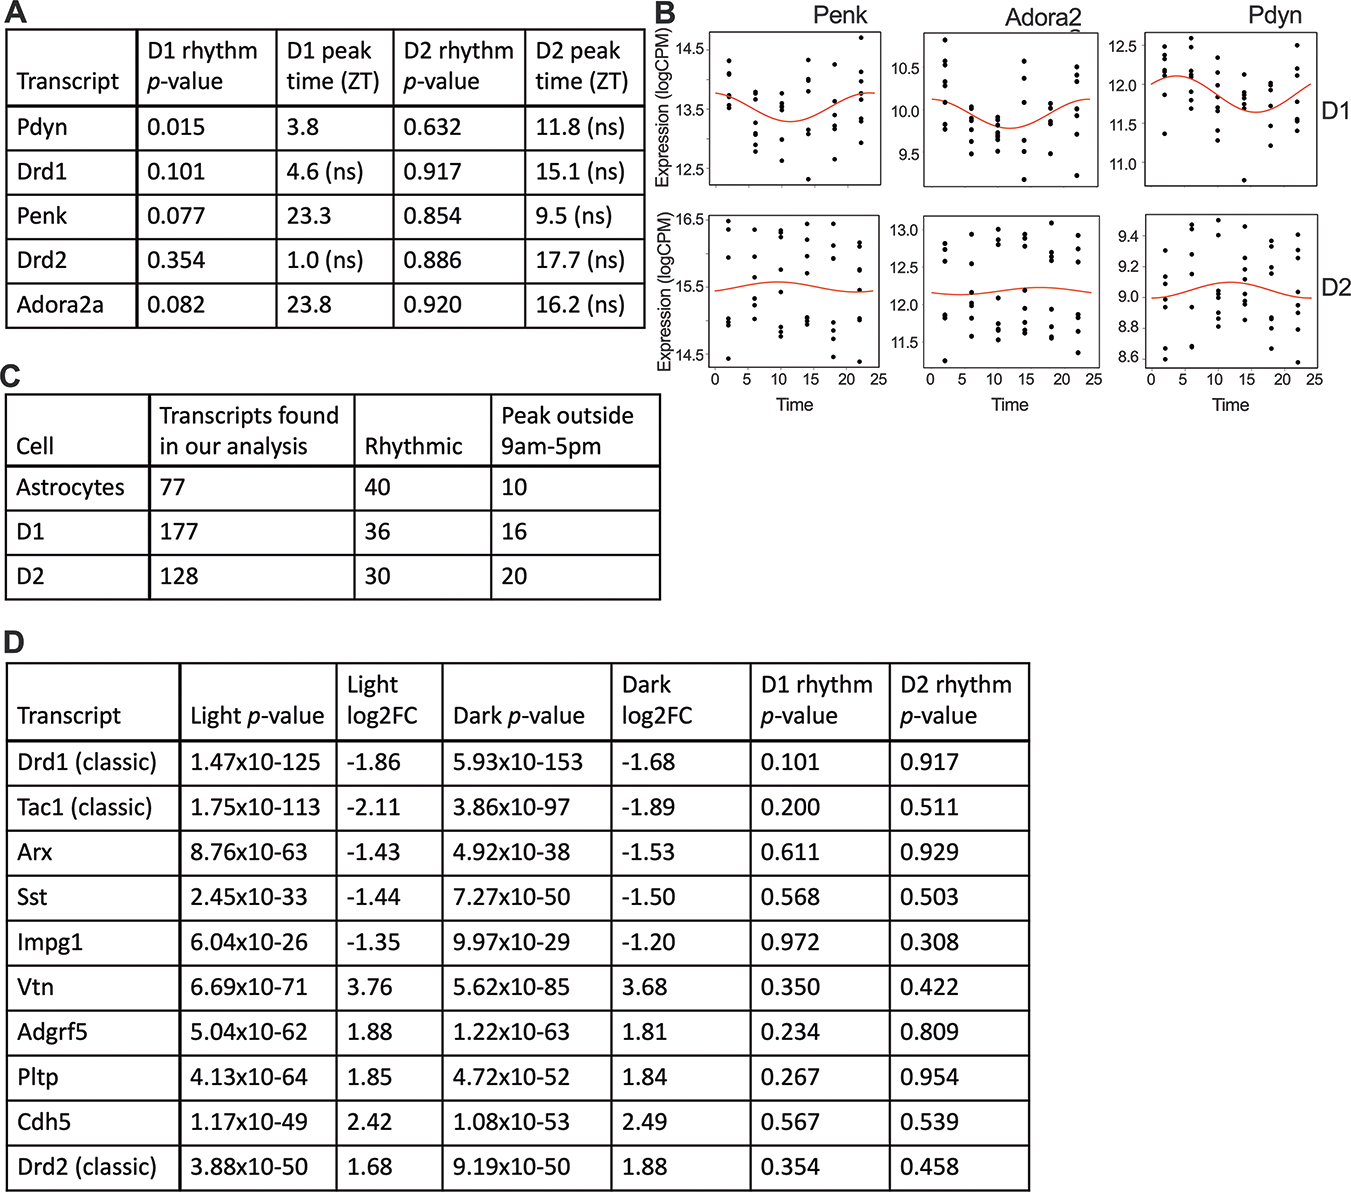
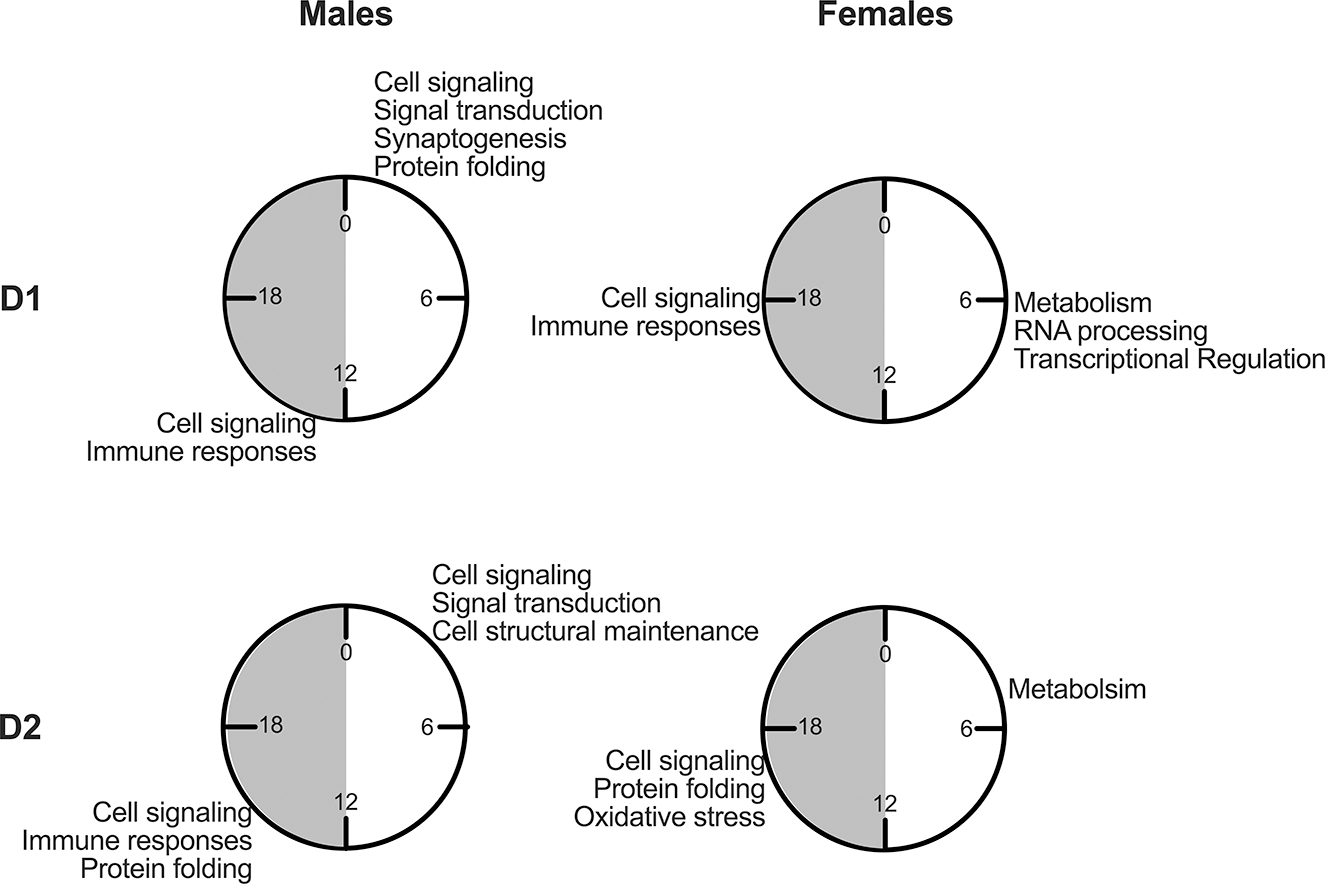
Circadian rhythms are critical for human health and are highly conserved across species. Disruptions in these rhythms contribute to many diseases, including psychiatric disorders. Previous results suggest that circadian genes modulate behavior through specific cell types in the nucleus accumbens (NAc), particularly dopamine D1-expressing medium spiny neurons (MSNs). However, diurnal rhythms in transcript expression have not been investigated in NAc MSNs. In this study we identified and characterized rhythmic transcripts in D1- and D2-expressing neurons and compared rhythmicity results to homogenate as well as astrocyte samples taken from the NAc of male and female mice. We find that all cell types have transcripts with diurnal rhythms and that top rhythmic transcripts are largely core clock genes, which peak at approximately the same time of day in each cell type and sex. While clock-controlled rhythmic transcripts are enriched for protein regulation pathways across cell type, cell signaling and signal transduction related processes are most commonly enriched in MSNs. In contrast to core clock genes, these clock-controlled rhythmic transcripts tend to reach their peak in expression about 2-h later in females than males, suggesting diurnal rhythms in reward may be delayed in females. We also find sex differences in pathway enrichment for rhythmic transcripts peaking at different times of day. Protein folding and immune responses are enriched in transcripts that peak in the dark phase, while metabolic processes are primarily enriched in transcripts that peak in the light phase. Importantly, we also find that several classic markers used to categorize MSNs are rhythmic in the NAc. This is critical since the use of rhythmic markers could lead to over- or under-enrichment of targeted cell types depending on the time at which they are sampled. This study greatly expands our knowledge of how individual cell types contribute to rhythms in the NAc.
© 2024. The Author(s), under exclusive licence to Springer Nature Limited.
Conflict of interest statement
Disclosures:
All authors have no financial disclosures or conflicts of interest to report.
Figures
References
-
- Reppert SM, Weaver DR. Coordination of circadian timing in mammals. Nature. 2002;418:935–41. - PubMed
-
- Ko CH, Takahashi JS. Molecular components of the mammalian circadian clock. Hum Mol Genet. 2006;15:R271–7. - PubMed
-
- Easton A, Arbuzova J, Turek FW. The circadian Clock mutation increases exploratory activity and escape-seeking behavior. Genes Brain Behav. 2003;2:11–9. - PubMed
MeSH terms
Substances
Grants and funding
- MH106460/U.S. Department of Health & Human Services | NIH | National Institute of Mental Health (NIMH)
- P50 DA046346/DA/NIDA NIH HHS/United States
- T32 NS007433/NS/NINDS NIH HHS/United States
- DA046346/U.S. Department of Health & Human Services | NIH | National Institute on Drug Abuse (NIDA)
- 30823/Brain and Behavior Research Foundation (Brain & Behavior Research Foundation)
- R01 MH106460/MH/NIMH NIH HHS/United States
- K99 DA055064/DA/NIDA NIH HHS/United States
- F32 DA046117/DA/NIDA NIH HHS/United States
- R01 DA039865/DA/NIDA NIH HHS/United States
- R01 MH111601/MH/NIMH NIH HHS/United States
- DA055064/U.S. Department of Health & Human Services | NIH | National Institute on Drug Abuse (NIDA)
- K01 MH128763/MH/NIMH NIH HHS/United States
- L60 DA054665/DA/NIDA NIH HHS/United States
- 29386/Brain and Behavior Research Foundation (Brain & Behavior Research Foundation)
- MH128763/U.S. Department of Health & Human Services | NIH | National Institute of Mental Health (NIMH)
- DA039865/U.S. Department of Health & Human Services | NIH | National Institute on Drug Abuse (NIDA)
- MH111601/U.S. Department of Health & Human Services | NIH | National Institute of Mental Health (NIMH)
- S10 OD028483/OD/NIH HHS/United States
- L60DA054665/U.S. Department of Health & Human Services | NIH | National Institute on Drug Abuse (NIDA)
LinkOut - more resources
Full Text Sources
