. 2024 Apr 27;10(1):45.
doi: 10.1038/s41540-024-00370-4.

Computational modeling reveals key factors driving treatment-free remission in chronic myeloid leukemia patients

Affiliations

Computational modeling reveals key factors driving treatment-free remission in chronic myeloid leukemia patients

Xiulan Lai et al. NPJ Syst Biol Appl. .

Abstract

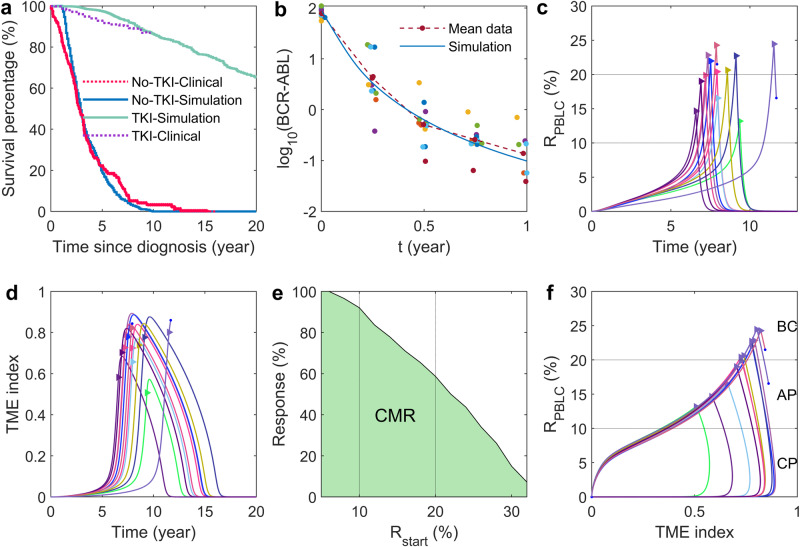
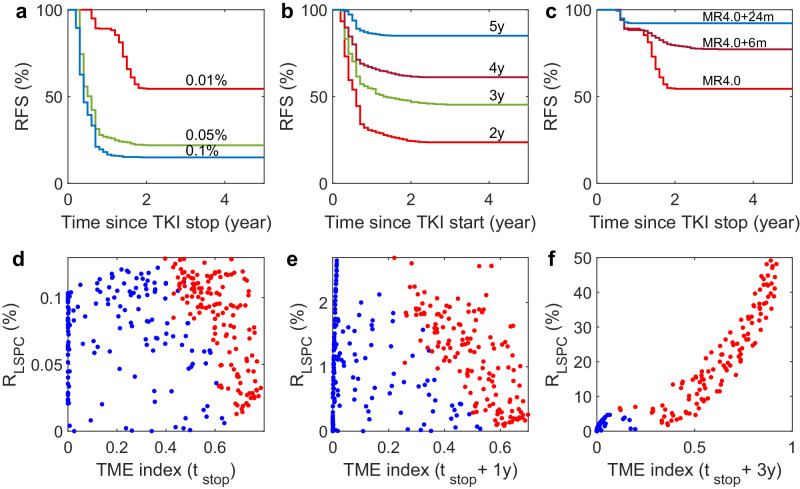
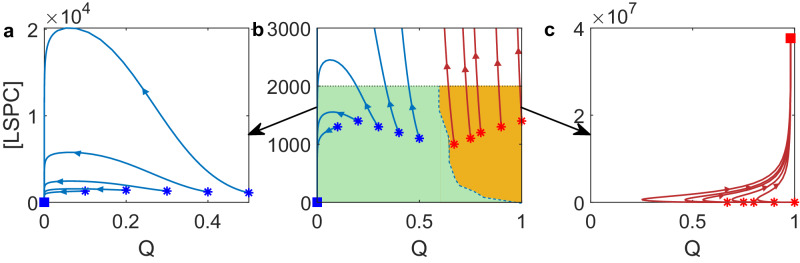
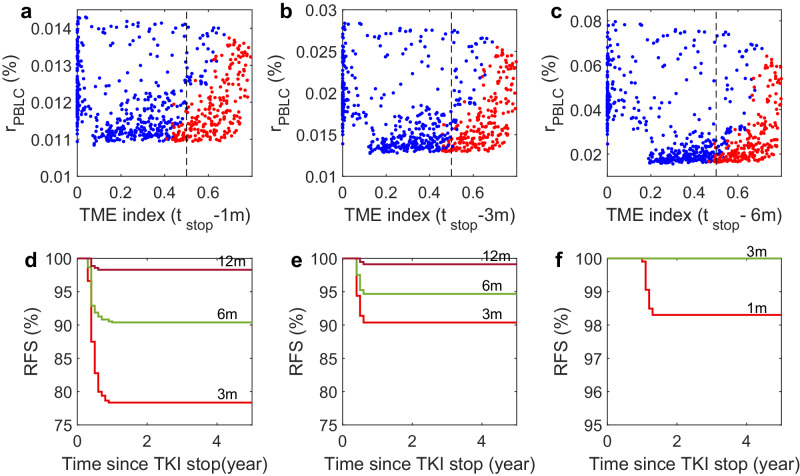
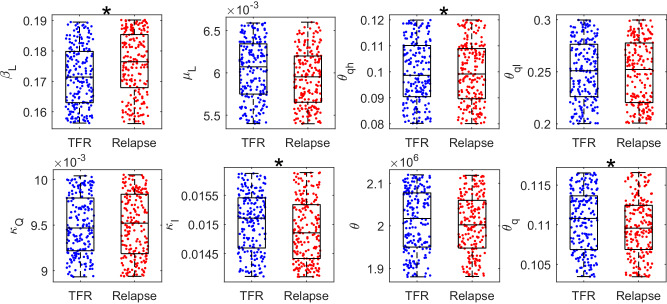
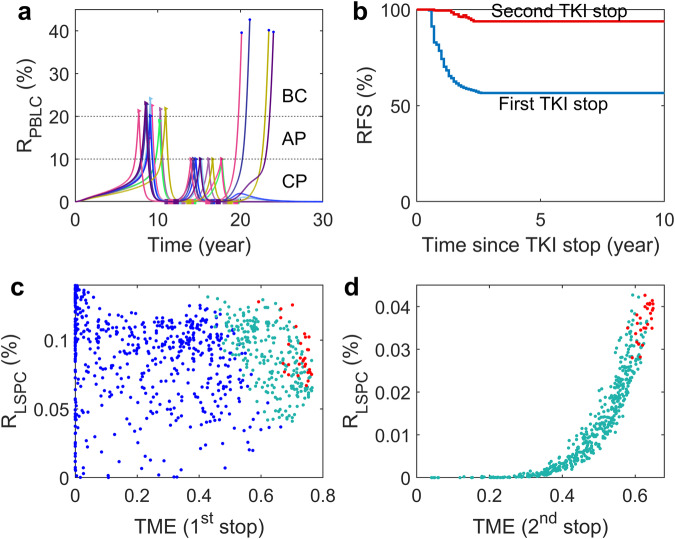
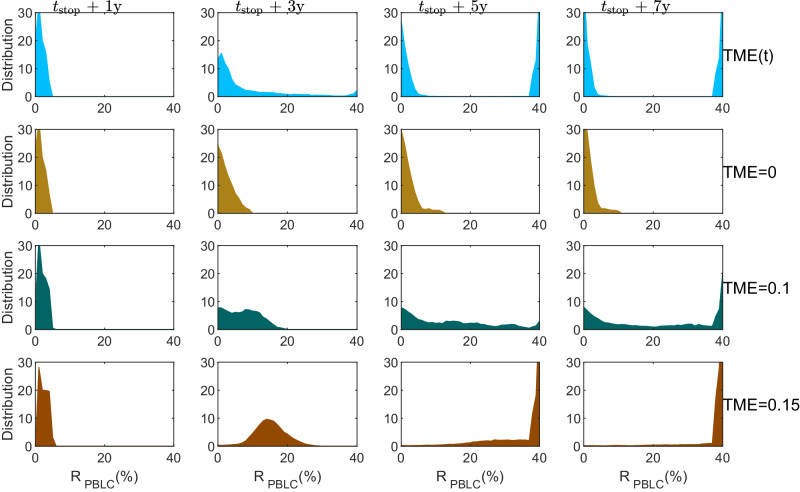
Patients with chronic myeloid leukemia (CML) who receive tyrosine kinase inhibitors (TKIs) have been known to achieve treatment-free remission (TFR) upon discontinuing treatment. However, the underlying mechanisms of this phenomenon remain incompletely understood. This study aims to elucidate the mechanism of TFR in CML patients, focusing on the feedback interaction between leukemia stem cells and the bone marrow microenvironment. We have developed a mathematical model to explore the interplay between leukemia stem cells and the bone marrow microenvironment, allowing for the simulation of CML progression dynamics. Our proposed model reveals a dichotomous response following TKI discontinuation, with two distinct patient groups emerging: one prone to early molecular relapse and the other capable of achieving long-term TFR after treatment cessation. This finding aligns with clinical observations and underscores the essential role of feedback interaction between leukemic cells and the tumor microenvironment in sustaining TFR. Notably, we have shown that the ratio of leukemia cells in peripheral blood (PBLC) and the tumor microenvironment (TME) index can be a valuable predictive tool for identifying patients likely to achieve TFR after discontinuing treatment. This study provides fresh insights into the mechanism of TFR in CML patients and underscores the significance of microenvironmental control in achieving TFR.


Conflict of interest statement

The authors declare no competing interests.

Figures

Fig. 1
Fig. 1. Schematic representation of CML evolution driven by the tumor microenvironment.
Black arrows indicate cell interaction/transitions, red arrows show the interactions associated with the microenvironment, and grey arrows represent cell death.
Fig. 2
Fig. 2. Data analysis of CML evolution.
a CD34 expression level of patients in three phases of CML evolution: chronic phase (CP), accelerated phase (AP), and blast crisis (BC). b Disease age versus CD34 expression level through the equation (1). Red, green, and black dots denote CP, AP, and BC patients, respectively. c Evolution of blast counts of patients. Green, blue, and red dots denote CP, AP, and BC patients, respectively. The blue curve represents the average of 1000 sample simulations. d PBLC percentage in the peripheral blood versus the TME index during CML evolution without therapy obtained by model simulation.
Fig. 3
Fig. 3. CML evolution for patients under continuous imatinib treatment.
a Overall survival rates of CML patients. The red dotted line represents data from MD Anderson Cancer Center for patients who received no treatment. The blue line represents the model simulation of patients without treatment. The magenta dotted line represents data from the German CML study group since 1983. The green line represents the simulation of patients who received continuous imatinib treatment. b Decreasing of the BCR-ABL1 ratio after imatinib therapy in patients with CML. The BCR-ABL1 ratio is defined as [PBLC]2[PBHC]+[PBLC], as described in Clapp et al., where [PBLC] and [PBHC] represent the counts of leukemia cells and hematological cells in the peripheral blood, respectively. The dots show the clinical data obtained from Clapp et al., in which the patients responded well to imatinib. c The dynamics of the PBLC ratio (RPBLC) for 10 virtual patients who received continuous imatinib therapy. The therapy was initiated randomly for each patient after the PBLC ratio (RPBLC) reached a level between 5% and 25%. The triangle markers indicate the start of TKI therapy, while the dots at the end of some curves show the death of those patients. d The dynamics of the TME index. Data were obtained from the group of 10 virtual patients. e The percentage of CML patients achieving complete molecular remission varies based on their PBLC ratio at treatment initiation, noted by Rstart. f The relationship between the PBLC ratio and TME index during CML progression before and after continuous imatinib treatment. Data were obtained from the group of 10 virtual patients. All parameter values are the same as in Supplementary Table 1. Initial values of [HSPC] and [PBHC] are set to 1.8 × 106 and 1.44 × 107cells, respectively, and the values of [LSPC], [PBLC], and Q are set to zero.
Fig. 4
Fig. 4. CML evolution for patients with discontinuous TKI therapy.
a Dynamics of PBLC ratio (RPBLC) for virtual patients with TKI therapy initiated randomly when 5% < RPBLC < 25% and stopped when RPBLC = 0.01%. The starting and stopping points of TKI therapy are marked with triangle and square markers, respectively. The circle points at the end of the curves indicate the death of the virtual patients. b Typical trajectories of PBLC ratio versus TME index for two patients with relapse (red) and TFR (blue) after treatment discontinuation. The trajectories before and after treatment discontinuation are shown with dashed and solid lines, respectively. The stars indicate the points of treatment discontinuation. c Trajectories of LSPC versus TME index for the two patients in (b) with relapse (red) and TFR (blue). The vertical black dashed line shows the critical line (Q = 0.127) of the TME index that separates the fate of either tumor relapse or TFR. The critical value is discussed in Methods. d Comparison of the time to AP during phases of prior treatment and during the relapse process after stopping treatment in each relapsed patient. e Molecular relapse-free survival (RFS) curve after TKI stop. All parameter values are the same as in Supplementary Table 1.
Fig. 5
Fig. 5. Mechanisms of TFR after imatinib discontinuation for virtual patients.
a Molecular relapse-free survival (RFS) curves of virtual patients stopped imatinib therapy at PBLC percentage level RPBLC = 0.01%, 0.05%, 0.1%, respectively. b Molecular relapse-free survival curves for virtual patients who stopped imatinib therapy after treatment for 2, 3, 4, and 5 years, respectively. c Molecular relapse-free survival curves of virtual patients who stopped imatinib therapy when PBLC percentage level reaches MR4.0 (RPBLC = 0.01%), or with 6 or 24 more months of treatment after RPBLC = 0.01%. df LSPC percentage and TME index at the time of stopping treatment, 1 and 3 years after stopping treatment for virtual patients, respectively. Treatment is stopped when the PBLC percentage level reaches RPBLC = 0.01%. Red dots represent relapsed patients, and blue dots represent TFR patients after treatment discontinuations.
Fig. 6
Fig. 6. Phase space for the ordinary differential equation model (3).
a Solutions with a small initial TME index converge to the stable steady state without LSPC. b The separation of regions of initial values of [LSPC] and Q that either developed to TFR (green) and tumor relapse (orange). Here, the initial value [HSPC] = 1.0 × 107. c Solutions with a large TME index converge to a steady state with a high level of LSPC.
Fig. 7
Fig. 7. Prediction of treatment-free remission for virtual patients.
ac TME index and RPBLC for TFR patients (blue dots) and relapsed patients (red dots) at (a) 1 month, (b) 3 months, and (c) 6 months before stopping the imatinib treatment. Dashed lines indicate the separation with TME index Q = 0.5. d Molecular relapse-free survival (RFS) curves for patients who stopped treatment at 3 months, 6 months, or 12 months after satisfying the predictive criterion P1. e RFS curves for patients who stopped treatment at 3 months, 6 months, or 12 months after satisfying the predictive criterion P2. f Molecular relapse-free survival (RFS) curves for patients who stopped treatment at 1 or 3 months after satisfying the predictive criterion P3.
Fig. 8
Fig. 8. Distribution of parameter values for relapsed and TFR patients.
The parameter value distributions of βL, μL, θqh, θql, κQ, κI, θ, and θq for relapsed patients (red) and TFR patients (blue). Black starts indicate the parameters with p-values less than 0.05 (t-test). Here, βL and μL represent the proliferation rate and apoptosis of LSPC, respectively; θqh and θql indicate the effective TME level for promotion of HSPC apoptosis and inhibition of LSPC apoptosis, respectively; κQ and κI imply the rates of transformation from NME to TME, and rates of restoring NME from TME, respectively; θ represents the effective LSPC level in promoting NME to TME transition; θq indicates effective TME level in inhibition of TME depredation.
Fig. 9
Fig. 9. CML evolution and mechanisms of TFR after the second discontinuation of imatinib treatment in virtual patients.
a Dynamics of PBLC ratio (RPBLC) for 10 virtual patients. b Molecular relapse-free survival curves of patients. c LSPC percentage and TME index when stopping imatinib treatment for the first time. Blue dots represent the data for TFR patients after the first imatinib discontinuation; cyan dots represent patients with CML relapse after the first imatinib discontinuation but TFR after the second imatinib discontinuation; red dots represent relapsed patients after both the first and second imatinib discontinuations. d LSPC percentage and TME index when stopping imatinib treatment for the second time. Cyan dots represent the data for TFR patients after the second imatinib discontinuation; red dots represent relapsed patients after the second imatinib discontinuation. In all the simulations, virtual patients started imatinib treatment randomly when 5% < RPBLC < 25%, stopped imatinib treatment at Rstop = 0.01% of PBLC percentage level for the first time, restarted treatment when RPBLC ≥ 10%, and then stopped imatinib therapy again at Rstop = 0.01% of PBLC percentage level.
Fig. 10
Fig. 10. Evolution of PBLC ratio distribution after TKI treatment discontinuation for virtual patients.
Four-row panels show the distributions of PBLC ratios at 1, 3, 5, and 7 years after TKI treatment discontinuation for virtual patients with dynamically changed TME based on the proposed random differential equation model (TME(t)), or constant TME with TME = 0, 0.1, and 0.15, respectively. Here, tstop indicates the time point of TKI discontinuation. The mortalities of virtual patients were ignored in model simulations. The distributions are calculated from 1000 samples for each case.

Similar articles

References

    1. Torres-Barrera P, Mayani H, Chavez-Gonzalez A. Understanding the hematopoietic microenvironment in chronic myeloid leukemia: a concise review. Curr. Res. Transl. Med. 2021;69:103295. doi: 10.1016/j.retram.2021.103295. - DOI - PubMed
    1. Bartram CR, et al. Translocation of c-abl oncogene correlates with the presence of a Philadelphia chromosome in chronic myelocytic leukaemia. Nature. 1983;306:277. doi: 10.1038/306277a0. - DOI - PubMed
    1. Kurzrock R, Gutterman JU, Talpaz M. The molecular genetics of Philadelphia chromosome–positive leukemias. N. Engl. J. Med. 1988;319:990–998. doi: 10.1056/NEJM198810133191506. - DOI - PubMed
    1. Holyoake T, Vetrie D. The chronic myeloid leukemia stem cell: stemming the tide of persistence. Blood. 2017;129:1595–1606. doi: 10.1182/blood-2016-09-696013. - DOI - PubMed
    1. Druker BJ, et al. Five-year follow-up of patients receiving imatinib for chronic myeloid leukemia. N. Engl. J. Med. 2006;355:2408–2417. doi: 10.1056/NEJMoa062867. - DOI - PubMed

Publication types

MeSH terms

Substances