

Altered mucosal bacteria and metabolomics in patients with Peutz-Jeghers syndrome
- PMID: 38678229
- PMCID: PMC11056063
- DOI: 10.1186/s13099-024-00617-9
Altered mucosal bacteria and metabolomics in patients with Peutz-Jeghers syndrome
Abstract
Background: Peutz-Jeghers syndrome (PJS) is a rare genetic disorder characterized by the development of pigmented spots, gastrointestinal polyps and increased susceptibility to cancers. Currently, most studies have investigated intestinal microbiota through fecal microbiota, and there are few reports about mucosa-associated microbiota. It remains valuable to search for the key intestinal microbiota or abnormal metabolic pathways linked to PJS.
Aim: This study aimed to assess the structure and composition of mucosa-associated microbiota in patients with PJS and to explore the potential influence of intestinal microbiota disorders and metabolite changes on PJS.
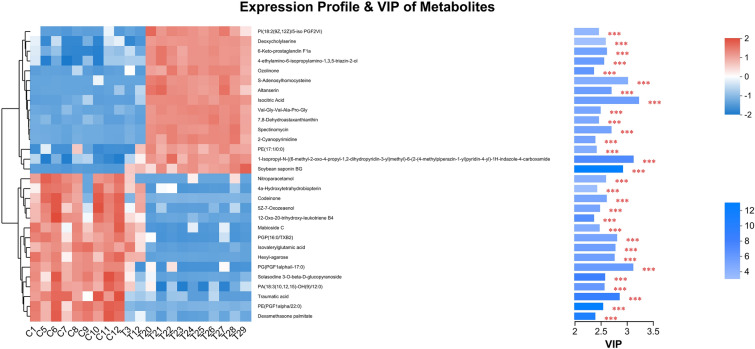
Methods: The bacterial composition was analyzed in 13 PJS patients and 12 controls using 16S rRNA gene sequencing (Illumina MiSeq) for bacteria. Differential analyses of the intestinal microbiota were performed from the phylum to species level. Liquid chromatography-tandem mass spectrometry (LC‒MS) was used to detect the differentially abundant metabolites of PJS patients and controls to identify different metabolites and metabolic biomarkers of small intestinal mucosa samples.
Results: High-throughput sequencing confirmed the special characteristics and biodiversity of the mucosa microflora in patients with PJS. They had lower bacterial biodiversity than controls. The abundance of intestinal mucosal microflora was significantly lower than that of fecal microflora. In addition, lipid metabolism, amino acid metabolism, carbohydrate metabolism, nucleotide metabolism and other pathways were significantly different from those of controls, which were associated with the development of the enteric nervous system, intestinal inflammation and development of tumors.
Conclusion: This is the first report on the mucosa-associated microbiota and metabolite profile of subjects with PJS, which may be meaningful to provide a structural basis for further research on intestinal microecology in PJS.
Keywords: Bacteria; LC‒MS; Metabolomics; Mucosa-associated microbiota; Peutz–Jeghers syndrome.
© 2024. The Author(s).
Conflict of interest statement
The authors report no competing interest.
Figures


Similar articles
-
Altered Gut Microbiota in Patients With Peutz-Jeghers Syndrome.Front Microbiol. 2022 Jul 13;13:881508. doi: 10.3389/fmicb.2022.881508. eCollection 2022. Front Microbiol. 2022. PMID: 35910641 Free PMC article.
-
Alterations and clinical relevance of gut microbiota in patients with Peutz-Jeghers syndrome: A prospective study.J Dig Dis. 2023 Mar;24(3):203-212. doi: 10.1111/1751-2980.13175. Epub 2023 Jun 6. J Dig Dis. 2023. PMID: 37158702
-
Changes in the Gut Microbiome Associated with Intussusception in Patients with Peutz-Jeghers Syndrome.Microbiol Spectr. 2023 Jan 31;11(2):e0281922. doi: 10.1128/spectrum.02819-22. Online ahead of print. Microbiol Spectr. 2023. PMID: 36719190 Free PMC article.
-
Peutz-Jeghers syndrome: Skin manifestations and endocrine anomalies (Review).Exp Ther Med. 2021 Dec;22(6):1387. doi: 10.3892/etm.2021.10823. Epub 2021 Sep 29. Exp Ther Med. 2021. PMID: 34650635 Free PMC article. Review.
-
Peutz-Jeghers syndrome: risks of a hereditary condition.Scand J Gastroenterol Suppl. 1999;230:64-70. doi: 10.1080/003655299750025561. Scand J Gastroenterol Suppl. 1999. PMID: 10499464 Review.
Cited by
-
Global research landscape of Peutz-Jeghers syndrome and successful endoscopic management of intestinal intussusception in patients with recurrent laparotomies.World J Gastrointest Surg. 2024 Aug 27;16(8):2702-2718. doi: 10.4240/wjgs.v16.i8.2702. World J Gastrointest Surg. 2024. PMID: 39220083 Free PMC article.
References
Grants and funding
LinkOut - more resources
Full Text Sources
