

Histone proteoform analysis reveals epigenetic changes in adult mouse brown adipose tissue in response to cold stress
- PMID: 38678237
- PMCID: PMC11055387
- DOI: 10.1186/s13072-024-00536-8
Histone proteoform analysis reveals epigenetic changes in adult mouse brown adipose tissue in response to cold stress
Abstract
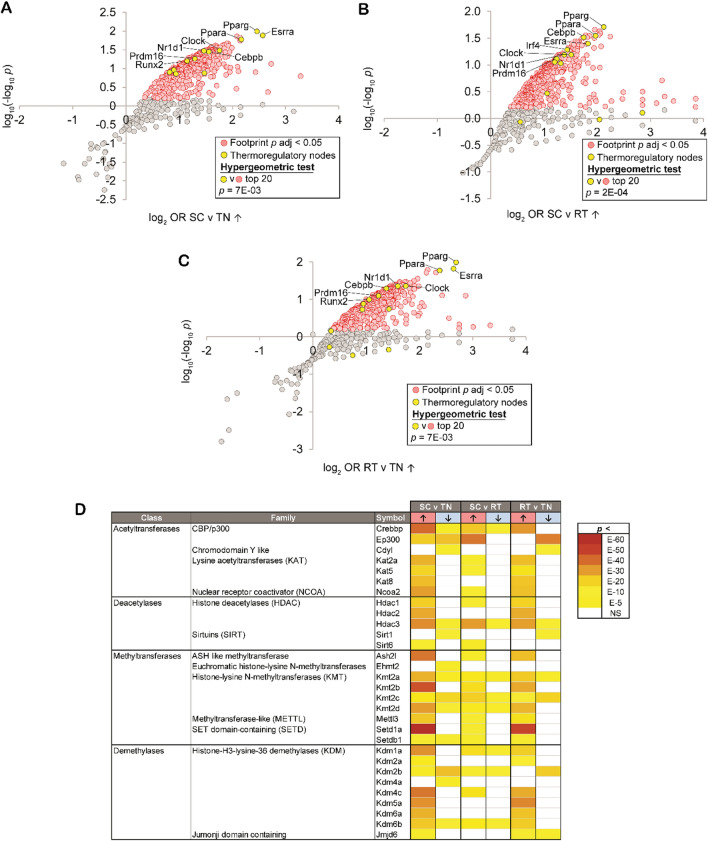
Background: Regulation of the thermogenic response by brown adipose tissue (BAT) is an important component of energy homeostasis with implications for the treatment of obesity and diabetes. Our preliminary analyses of RNA-Seq data uncovered many nodes representing epigenetic modifiers that are altered in BAT in response to chronic thermogenic activation. Thus, we hypothesized that chronic thermogenic activation broadly alters epigenetic modifications of DNA and histones in BAT.
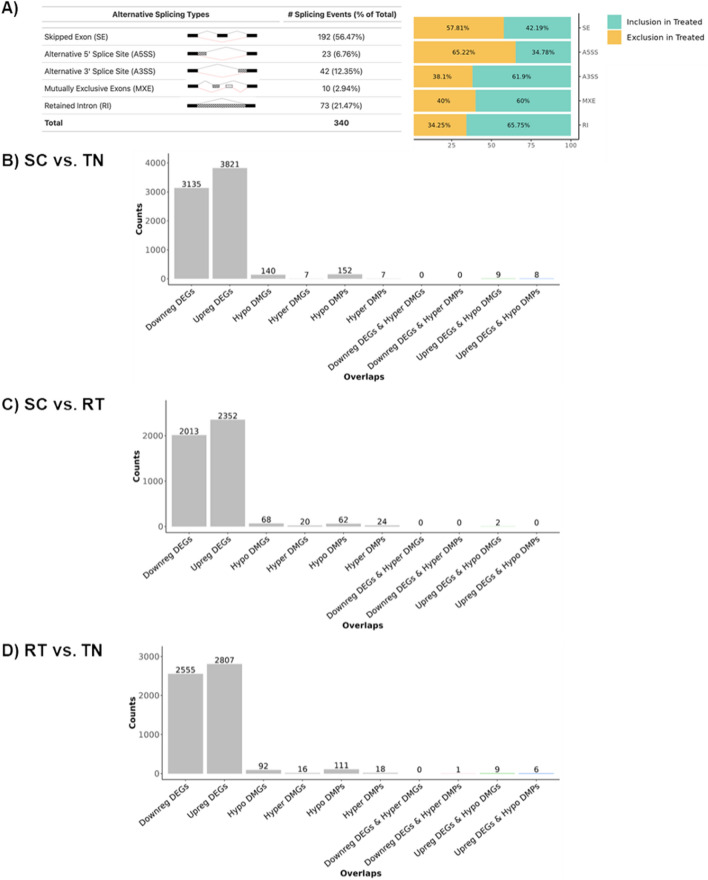
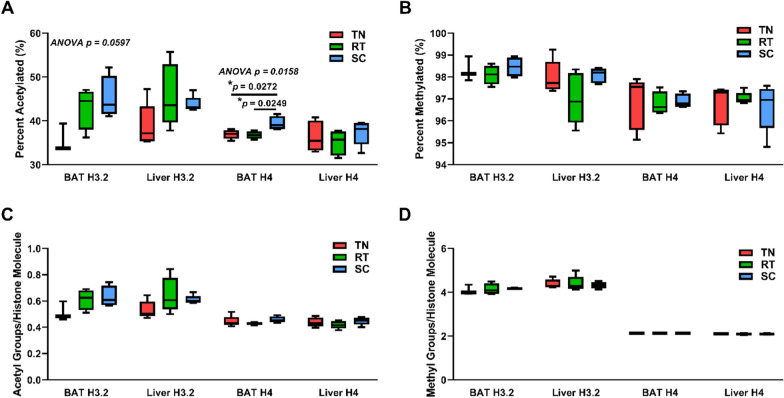
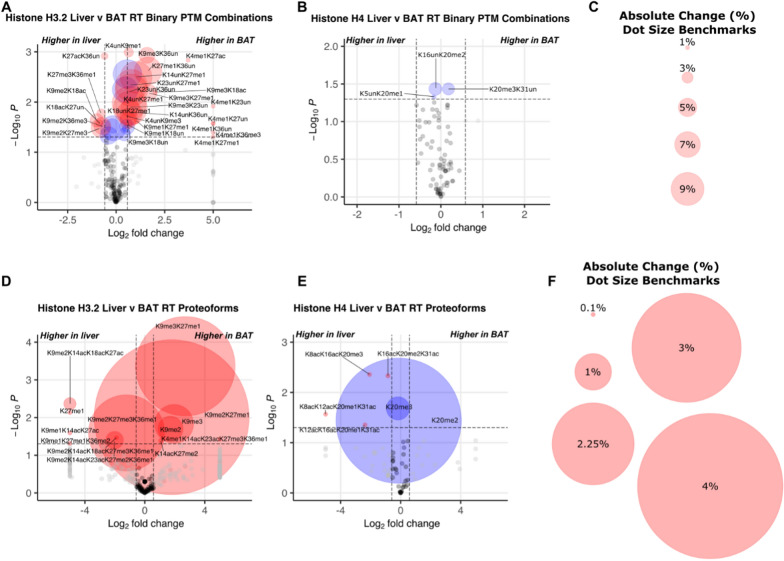
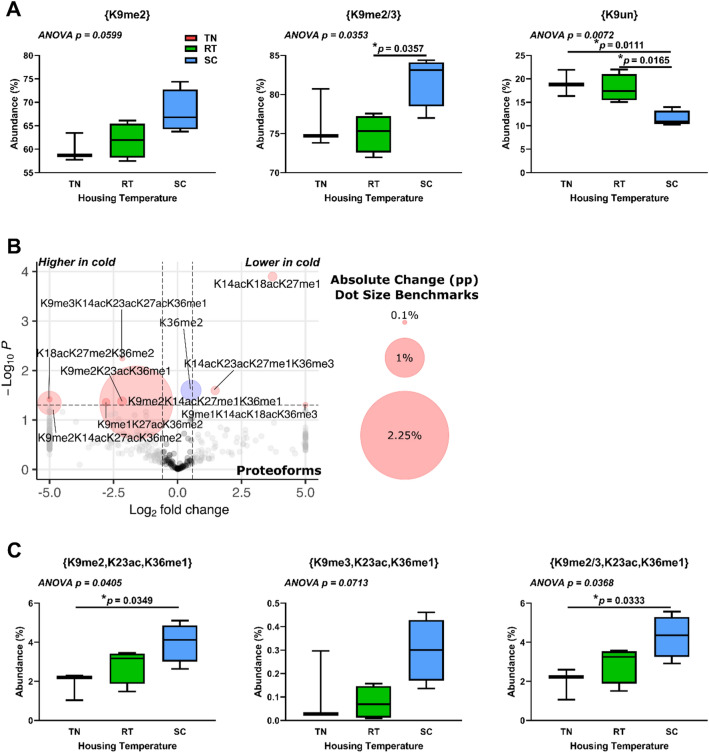
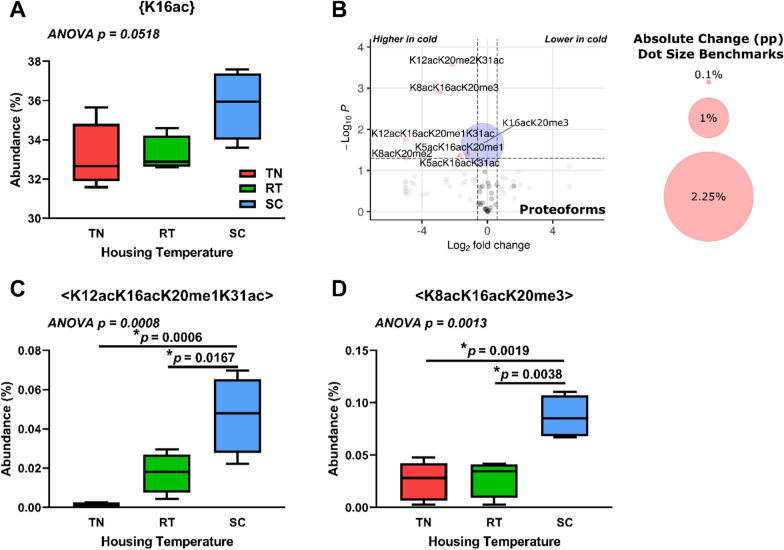
Results: Motivated to understand how BAT function is regulated epigenetically, we developed a novel method for the first-ever unbiased top-down proteomic quantitation of histone modifications in BAT and validated our results with a multi-omic approach. To test our hypothesis, wildtype male C57BL/6J mice were housed under chronic conditions of thermoneutral temperature (TN, 28°C), mild cold/room temperature (RT, 22°C), or severe cold (SC, 8°C) and BAT was analyzed for DNA methylation and histone modifications. Methylation of promoters and intragenic regions in genomic DNA decrease in response to chronic cold exposure. Integration of DNA methylation and RNA expression datasets suggest a role for epigenetic modification of DNA in regulation of gene expression in response to cold. In response to cold housing, we observe increased bulk acetylation of histones H3.2 and H4, increased histone H3.2 proteoforms with di- and trimethylation of lysine 9 (K9me2 and K9me3), and increased histone H4 proteoforms with acetylation of lysine 16 (K16ac) in BAT.
Conclusions: Our results reveal global epigenetically-regulated transcriptional "on" and "off" signals in murine BAT in response to varying degrees of chronic cold stimuli and establish a novel methodology to quantitatively study histones in BAT, allowing for direct comparisons to decipher mechanistic changes during the thermogenic response. Additionally, we make histone PTM and proteoform quantitation, RNA splicing, RRBS, and transcriptional footprint datasets available as a resource for future research.
Keywords: Brown adipose tissue; DNA methylation; Epigenetics; Gene expression; Histone; Thermogenesis.
© 2024. The Author(s).
Conflict of interest statement
The authors declare that they have no competing interests.
Figures

Update of
-
Histone proteoform analysis reveals epigenetic changes in adult mouse brown adipose tissue in response to cold stress.bioRxiv [Preprint]. 2024 Jan 22:2023.07.30.551059. doi: 10.1101/2023.07.30.551059. bioRxiv. 2024. Update in: Epigenetics Chromatin. 2024 Apr 27;17(1):12. doi: 10.1186/s13072-024-00536-8. PMID: 38328142 Free PMC article. Updated. Preprint.
Similar articles
-
Histone proteoform analysis reveals epigenetic changes in adult mouse brown adipose tissue in response to cold stress.bioRxiv [Preprint]. 2024 Jan 22:2023.07.30.551059. doi: 10.1101/2023.07.30.551059. bioRxiv. 2024. Update in: Epigenetics Chromatin. 2024 Apr 27;17(1):12. doi: 10.1186/s13072-024-00536-8. PMID: 38328142 Free PMC article. Updated. Preprint.
-
Ablation of FAM210A in Brown Adipocytes of Mice Exacerbates High-Fat Diet-Induced Metabolic Dysfunction.Diabetes. 2025 Mar 1;74(3):282-294. doi: 10.2337/db24-0294. Diabetes. 2025. PMID: 39602358
-
The TBLR1/TBL1 Co-Factor Complex Acts as a Transcriptional Checkpoint in the Brown Adipose Tissue Response to Prolonged Cold Exposure.FASEB J. 2025 Aug 15;39(15):e70886. doi: 10.1096/fj.202402993RRR. FASEB J. 2025. PMID: 40787784 Free PMC article.
-
The role of global and regional DNA methylation and histone modifications in glycemic traits and type 2 diabetes: A systematic review.Nutr Metab Cardiovasc Dis. 2016 Jul;26(7):553-566. doi: 10.1016/j.numecd.2016.04.002. Epub 2016 Apr 14. Nutr Metab Cardiovasc Dis. 2016. PMID: 27146363
-
[Epigenetics' implication in autism spectrum disorders: A review].Encephale. 2017 Aug;43(4):374-381. doi: 10.1016/j.encep.2016.07.007. Epub 2016 Sep 28. Encephale. 2017. PMID: 27692350 French.
Cited by
-
Normalized and Directional Interplay Scoring for the Interrogation of Proteoform Data.bioRxiv [Preprint]. 2024 Nov 18:2024.11.18.624157. doi: 10.1101/2024.11.18.624157. bioRxiv. 2024. Update in: J Proteome Res. 2025 Apr 04;24(4):1765-1777. doi: 10.1021/acs.jproteome.4c00877. PMID: 39605462 Free PMC article. Updated. Preprint.
-
Single-nucleus RNA sequencing reveals dynamic changes in the microenvironment of visceral adipose tissue and metabolic characteristics after cold exposure.Front Endocrinol (Lausanne). 2025 Mar 24;16:1562431. doi: 10.3389/fendo.2025.1562431. eCollection 2025. Front Endocrinol (Lausanne). 2025. PMID: 40196457 Free PMC article.
-
Cold-Induced DHRS4 Promotes Thermogenesis via Enhanced Fatty Acid β-Oxidation in Porcine Subcutaneous Adipocytes.Animals (Basel). 2025 Apr 22;15(9):1190. doi: 10.3390/ani15091190. Animals (Basel). 2025. PMID: 40362005 Free PMC article.
-
Epigenetics in evolution and adaptation to environmental challenges: pathways for disease prevention and treatment.Epigenomics. 2025 Apr;17(5):317-333. doi: 10.1080/17501911.2025.2464529. Epub 2025 Feb 13. Epigenomics. 2025. PMID: 39948759 Review.
-
The multifaceted regulation of white adipose tissue browning and their therapeutic potential.J Physiol Biochem. 2025 Aug 11. doi: 10.1007/s13105-025-01117-3. Online ahead of print. J Physiol Biochem. 2025. PMID: 40785003 Review.
References
-
- Labbé SM, Caron A, Bakan I, Laplante M, Carpentier AC, Lecomte R, et al. In vivo measurement of energy substrate contribution to cold-induced brown adipose tissue thermogenesis. FASEB J Off Publ Fed Am Soc Exp Biol. 2015;29(5):2046–2058. - PubMed
Publication types
MeSH terms
Substances
Grants and funding
LinkOut - more resources
Full Text Sources
Molecular Biology Databases
