

Melatonin improves influenza virus infection-induced acute exacerbation of COPD by suppressing macrophage M1 polarization and apoptosis
- PMID: 38678295
- PMCID: PMC11056066
- DOI: 10.1186/s12931-024-02815-0
Melatonin improves influenza virus infection-induced acute exacerbation of COPD by suppressing macrophage M1 polarization and apoptosis
Abstract
Background: Influenza A viruses (IAV) are extremely common respiratory viruses for the acute exacerbation of chronic obstructive pulmonary disease (AECOPD), in which IAV infection may further evoke abnormal macrophage polarization, amplify cytokine storms. Melatonin exerts potential effects of anti-inflammation and anti-IAV infection, while its effects on IAV infection-induced AECOPD are poorly understood.
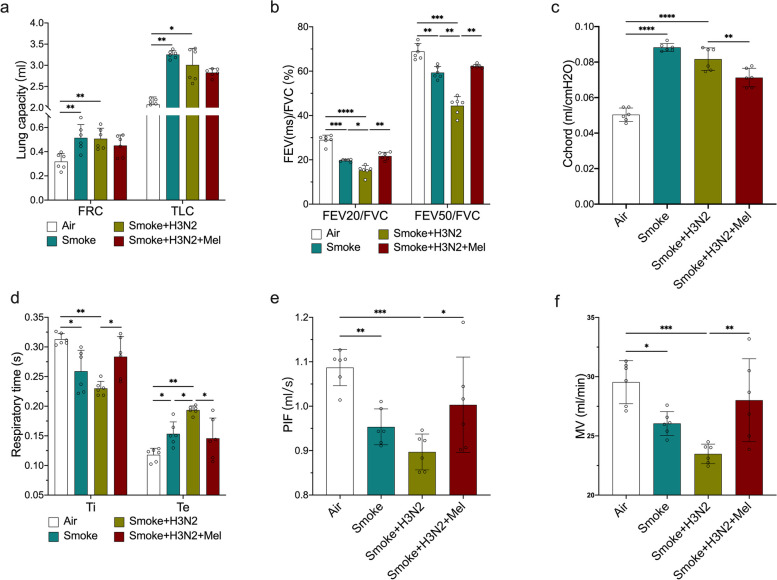
Methods: COPD mice models were established through cigarette smoke exposure for consecutive 24 weeks, evaluated by the detection of lung function. AECOPD mice models were established through the intratracheal atomization of influenza A/H3N2 stocks in COPD mice, and were injected intraperitoneally with melatonin (Mel). Then, The polarization of alveolar macrophages (AMs) was assayed by flow cytometry of bronchoalveolar lavage (BAL) cells. In vitro, the effects of melatonin on macrophage polarization were analyzed in IAV-infected Cigarette smoking extract (CSE)-stimulated Raw264.7 macrophages. Moreover, the roles of the melatonin receptors (MTs) in regulating macrophage polarization and apoptosis were determined using MTs antagonist luzindole.
Results: The present results demonstrated that IAV/H3N2 infection deteriorated lung function (reduced FEV20,50/FVC), exacerbated lung damages in COPD mice with higher dual polarization of AMs. Melatonin therapy improved airflow limitation and lung damages of AECOPD mice by decreasing IAV nucleoprotein (IAV-NP) protein levels and the M1 polarization of pulmonary macrophages. Furthermore, in CSE-stimulated Raw264.7 cells, IAV infection further promoted the dual polarization of macrophages accompanied with decreased MT1 expression. Melatonin decreased STAT1 phosphorylation, the levels of M1 markers and IAV-NP via MTs reflected by the addition of luzindole. Recombinant IL-1β attenuated the inhibitory effects of melatonin on IAV infection and STAT1-driven M1 polarization, while its converting enzyme inhibitor VX765 potentiated the inhibitory effects of melatonin on them. Moreover, melatonin inhibited IAV infection-induced apoptosis by suppressing IL-1β/STAT1 signaling via MTs.
Conclusions: These findings suggested that melatonin inhibited IAV infection, improved lung function and lung damages of AECOPD via suppressing IL-1β/STAT1-driven macrophage M1 polarization and apoptosis in a MTs-dependent manner. Melatonin may be considered as a potential therapeutic agent for influenza virus infection-induced AECOPD.
Keywords: Apoptosis; Chronic obstructive pulmonary disease; Influenza virus; Interleukin-1β; Macrophage polarization; Melatonin.
© 2024. The Author(s).
Conflict of interest statement
The authors declare no competing interests.
Figures


Similar articles
-
Melatonin Suppresses Macrophage M1 Polarization and ROS-Mediated Pyroptosis via Activating ApoE/LDLR Pathway in Influenza A-Induced Acute Lung Injury.Oxid Med Cell Longev. 2022 Nov 15;2022:2520348. doi: 10.1155/2022/2520348. eCollection 2022. Oxid Med Cell Longev. 2022. PMID: 36425057 Free PMC article.
-
Insights into the mechanism of action of pterostilbene against influenza A virus-induced acute lung injury.Phytomedicine. 2024 Jul;129:155534. doi: 10.1016/j.phymed.2024.155534. Epub 2024 Mar 24. Phytomedicine. 2024. PMID: 38583346
-
Bexarotene ameliorated the pulmonary inflammation and M1 polarization of alveolar macrophages induced by cigarette smoke via PPARγ/HO-1.Respir Res. 2024 Dec 18;25(1):431. doi: 10.1186/s12931-024-03064-x. Respir Res. 2024. PMID: 39696251 Free PMC article.
-
In Vivo and In Vitro Studies of Cigarette Smoke Effects on Innate Responses to Influenza Virus: A Matter of Models?Viruses. 2022 Aug 20;14(8):1824. doi: 10.3390/v14081824. Viruses. 2022. PMID: 36016446 Free PMC article. Review.
-
Macrophage Polarization and Functions in Pathogenesis of Chronic Obstructive Pulmonary Disease.Int J Mol Sci. 2024 May 22;25(11):5631. doi: 10.3390/ijms25115631. Int J Mol Sci. 2024. PMID: 38891820 Free PMC article. Review.
Cited by
-
ADAR1-HNRNPL-Mediated CircCANX Decline Promotes Autophagy in Chronic Obstructive Pulmonary Disease.Adv Sci (Weinh). 2025 May;12(18):e2414211. doi: 10.1002/advs.202414211. Epub 2025 Mar 17. Adv Sci (Weinh). 2025. PMID: 40091520 Free PMC article.
-
Melatonin enhances therapeutic outcomes of adipose tissue-derived mesenchymal stem cell therapy in rat osteoarthritis by reducing TNF-α and IL-1β-induced injuries.Cytotechnology. 2024 Oct;76(5):547-558. doi: 10.1007/s10616-024-00635-0. Epub 2024 Jun 8. Cytotechnology. 2024. PMID: 39188645
-
Efficacy of melatonin treatment in a cystic fibrosis mouse model of airway infection.Sci Rep. 2025 Jan 13;15(1):1849. doi: 10.1038/s41598-025-85948-6. Sci Rep. 2025. PMID: 39805903 Free PMC article.
-
Sestrin2 alleviates cognitive impairment via inhibiting hippocampus ferroptosis in cigarette smoke-induced chronic obstructive pulmonary disease.Redox Biol. 2025 Sep;85:103673. doi: 10.1016/j.redox.2025.103673. Epub 2025 May 13. Redox Biol. 2025. PMID: 40466570 Free PMC article.
-
The Physiological Impact of Melatonin, Its Effect on the Course of Diseases and Their Therapy and the Effect of Magnetic Fields on Melatonin Secretion-Potential Common Pathways of Influence.Biomolecules. 2024 Jul 31;14(8):929. doi: 10.3390/biom14080929. Biomolecules. 2024. PMID: 39199317 Free PMC article. Review.
References
MeSH terms
Substances
Grants and funding
- AHWJ2023A30280/the Health Research Youth Project of Anhui Province
- 82370040/National Natural Science Foundation of China
- 82170050/National Natural Science Foundation of China
- 2023AH010082/the Excellent Research and Innovation Team Plan of Anhui Province
- 202304295107020038/Clinical Medical Research and Transformation Project of Anhui Province
LinkOut - more resources
Full Text Sources
Medical
Research Materials
Miscellaneous
