

Chronic immunosuppression across 12 months and high ability of acute and subacute CNS-injury biomarker concentrations to identify individuals with complicated mTBI on acute CT and MRI
- PMID: 38678300
- PMCID: PMC11056044
- DOI: 10.1186/s12974-024-03094-8
Chronic immunosuppression across 12 months and high ability of acute and subacute CNS-injury biomarker concentrations to identify individuals with complicated mTBI on acute CT and MRI
Abstract
Background: Identifying individuals with intracranial injuries following mild traumatic brain injury (mTBI), i.e. complicated mTBI cases, is important for follow-up and prognostication. The main aims of our study were (1) to assess the temporal evolution of blood biomarkers of CNS injury and inflammation in individuals with complicated mTBI determined on computer tomography (CT) and magnetic resonance imaging (MRI); (2) to assess the corresponding discriminability of both single- and multi-biomarker panels, from acute to chronic phases after injury.
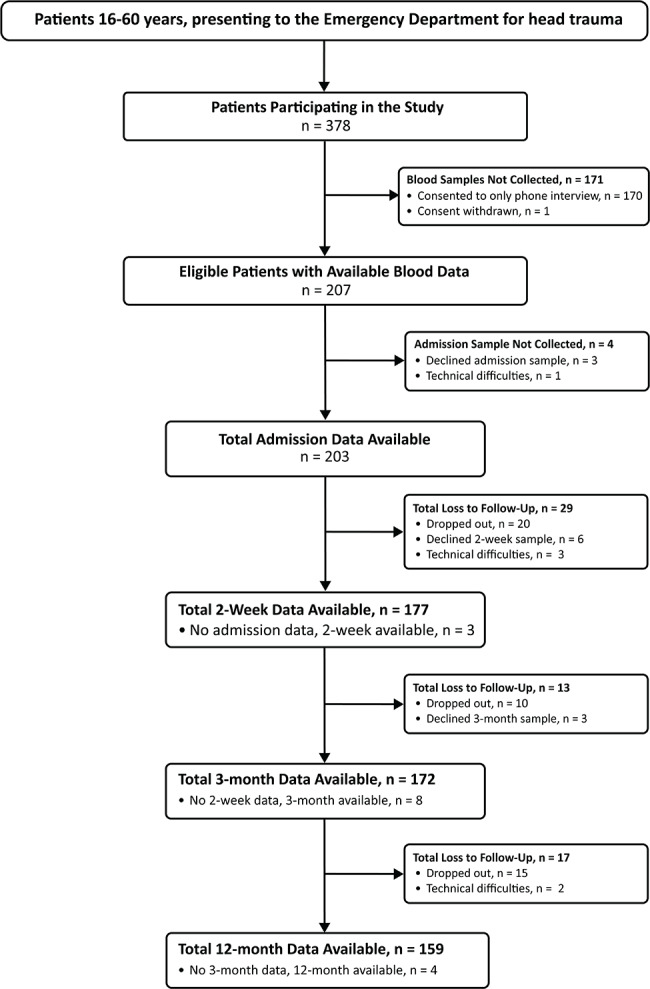
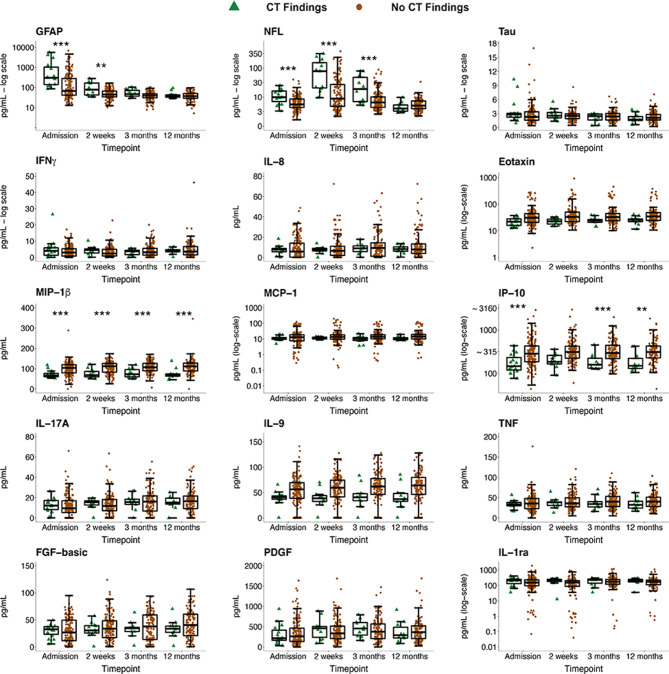
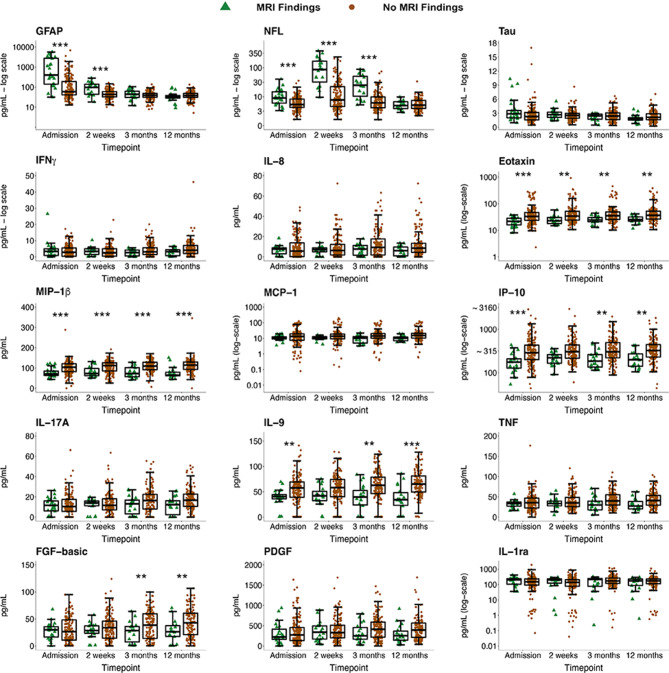
Methods: Patients with mTBI (n = 207), defined as Glasgow Coma Scale score between 13 and 15, loss of consciousness < 30 min and post-traumatic amnesia < 24 h, were included. Complicated mTBI - i.e., presence of any traumatic intracranial injury on neuroimaging - was present in 8% (n = 16) on CT (CT+) and 12% (n = 25) on MRI (MRI+). Blood biomarkers were sampled at four timepoints following injury: admission (within 72 h), 2 weeks (± 3 days), 3 months (± 2 weeks) and 12 months (± 1 month). CNS biomarkers included were glial fibrillary acidic protein (GFAP), neurofilament light (NFL) and tau, along with 12 inflammation markers.
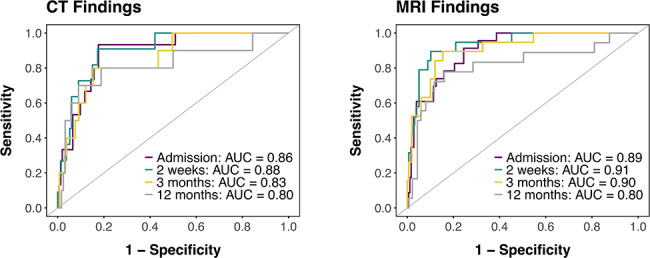
Results: The most discriminative single biomarkers of traumatic intracranial injury were GFAP at admission (CT+: AUC = 0.78; MRI+: AUC = 0.82), and NFL at 2 weeks (CT+: AUC = 0.81; MRI+: AUC = 0.89) and 3 months (MRI+: AUC = 0.86). MIP-1β and IP-10 concentrations were significantly lower across follow-up period in individuals who were CT+ and MRI+. Eotaxin and IL-9 were significantly lower in individuals who were MRI+ only. FGF-basic concentrations increased over time in MRI- individuals and were significantly higher than MRI+ individuals at 3 and 12 months. Multi-biomarker panels improved discriminability over single biomarkers at all timepoints (AUCs > 0.85 for admission and 2-week models classifying CT+ and AUC ≈ 0.90 for admission, 2-week and 3-month models classifying MRI+).
Conclusions: The CNS biomarkers GFAP and NFL were useful single diagnostic biomarkers of complicated mTBI, especially in acute and subacute phases after mTBI. Several inflammation markers were suppressed in patients with complicated versus uncomplicated mTBI and remained so even after 12 months. Multi-biomarker panels improved diagnostic accuracy at all timepoints, though at acute and 2-week timepoints, the single biomarkers GFAP and NFL, respectively, displayed similar accuracy compared to multi-biomarker panels.
Keywords: Concussion; Cytokines; Growth factors; Mixed-mechanism mild TBI; Neuroimaging; Prediction; Predictive modeling.
© 2024. The Author(s).
Conflict of interest statement
The authors declare no competing interests.
Figures
References
-
- Cassidy JD, Carroll LJ, Peloso PM, et al. Incidence, risk factors and prevention of mild traumatic brain injury: results of the WHO Collaborating Centre Task Force on mild traumatic brain Injury. J Rehabil Med. 2004;43 Suppl28–60. 10.1080/16501960410023732. - PubMed
-
- Hütter B-O, Altmeppen J, Kraff O, et al. Higher sensitivity for traumatic cerebral microbleeds at 7 T ultra-high field MRI: is it clinically significant for the acute state of the patients and later quality of life? Ther Adv Neurol Disord. 2020;13:1756286420911295. doi: 10.1177/1756286420911295. - DOI - PMC - PubMed
MeSH terms
Substances
LinkOut - more resources
Full Text Sources
Medical
Miscellaneous
